Fig. 1.
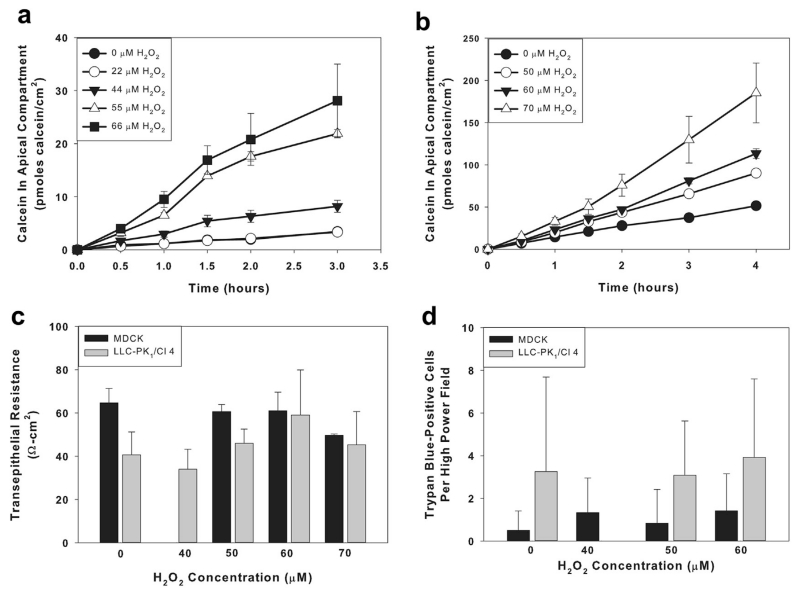
H2O2 increases in a concentration-dependent manner paracellular calcein movement across monolayers of renal epithelial cells. MDCK cell monolayers (a) and LLC-PK1 cell monolayers (b) were pretreated for 1 h without or with the indicated H2O2 concentration and then calcein movement was measured over the next 4 h in the continued presence of H2O2. Results are shown as mean ± SD for triplicate independent samples. Data are representative of at least 4 separate experiments. (c) Quantification of the effect of treatment with increasing concentrations of H2O2 for 5 h on transepithelial resistance of MDCK and LLC-PK1 cell monolayers. Results are shown as mean ± SD of 12 independent measurements. Data are representative of at least four separate experiments. (d) Quantification of the effect of treatment with increasing concentrations of H2O2 for 5 h on Trypan Blue-staining of MDCK cells and LLC-PK1 cells. Results are shown as mean ± SD of 12 independent measurements. Data are representative of at least four separate experiments.

