
Fig. 1.
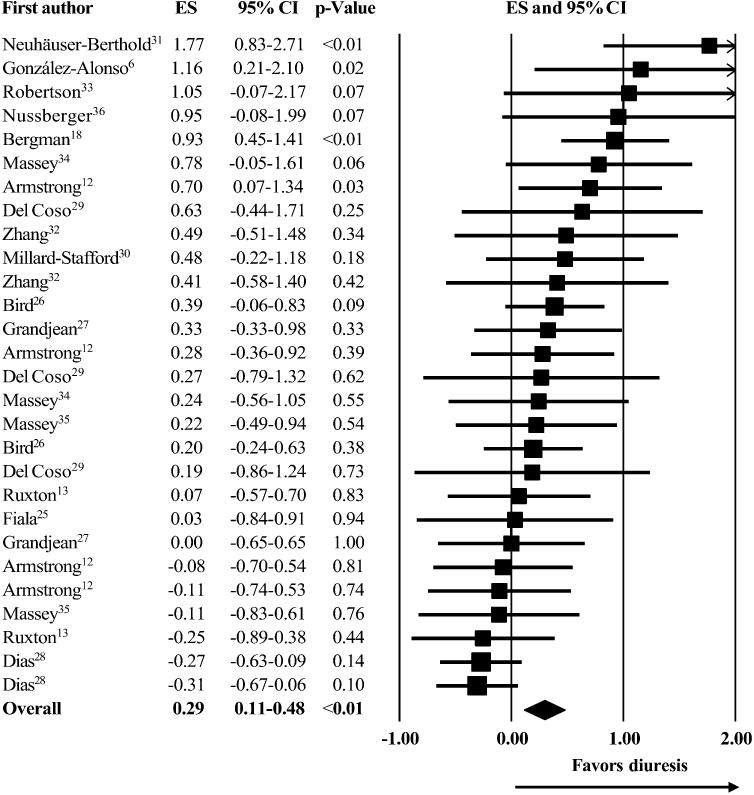
Meta-analysis of caffeine induced diuresis. Each square represents an effect size (ES) for a corresponding investigation with proportional square size according to its weighting. Each horizontal line represents the 95% confidence interval (CI) for an ES. The diamond represents the overall ES with its width according to the 95% CI for the overall ES.