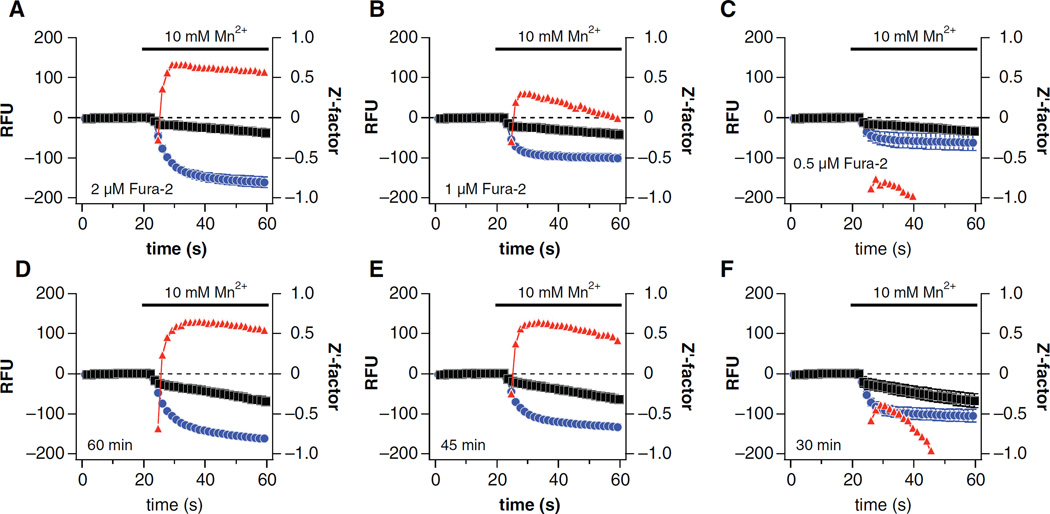
Fig. 3.
Optimization of fura-2-AM concentration and loading time. TRPM7-HEK293 cells (positive control, blue circles) and WT-HEK293 cells (negative controls, black squares) were incubated with (A) 2 µM, (B) 1 µM, or (C–F) 0.5 µM fura-2-AM for (A–D) 60 min, (E) 45 min, or (F) 30 min prior to reading. Each data point is the mean ± SD of 48 replicate wells, and Z′ factor values (red triangles) are plotted.

