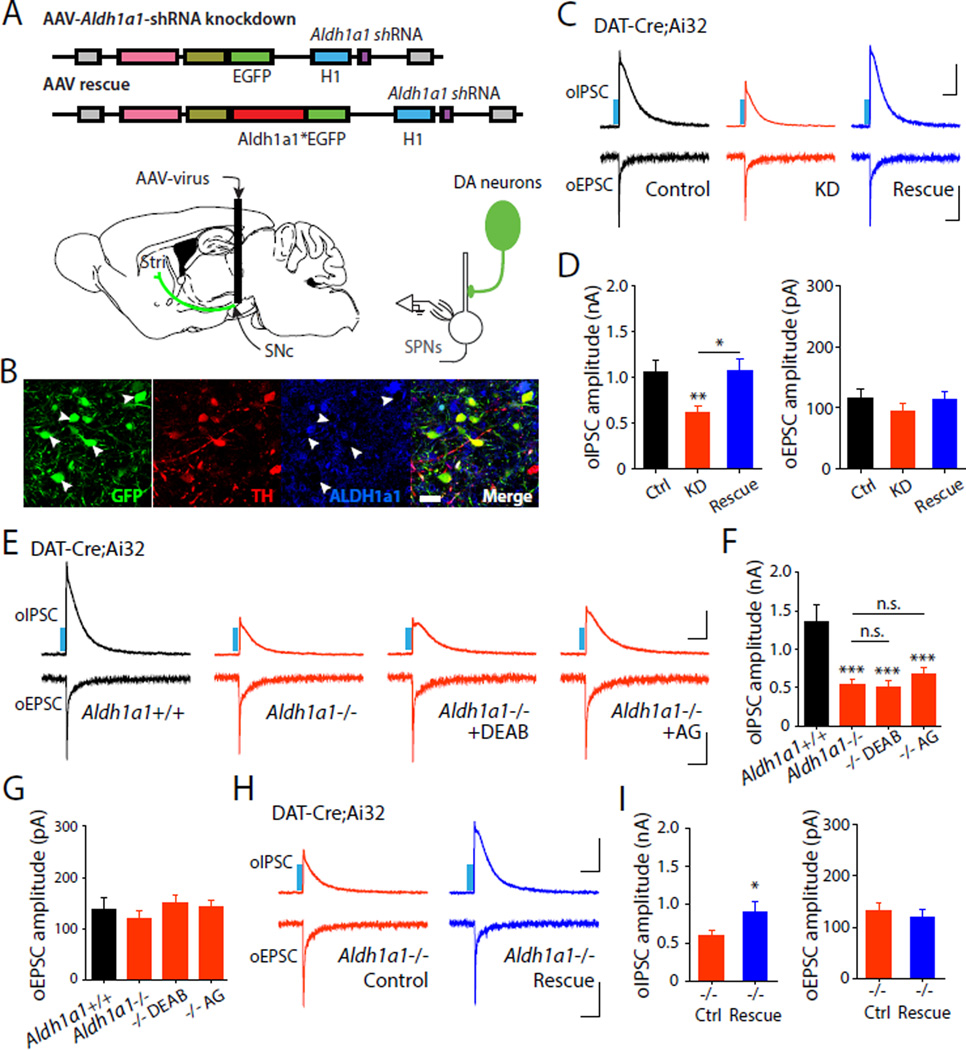
Fig. 3. Aldh1a1 knockdown and genetic deletion reduce dopaminergic oIPSCs and are rescued by Aldh1a1 over-expression.
(A) Schematic illustration depicting viral shRNA constructs (Aldh1a1* indicates an shRNA-resistant wild-type Aldh1a1) and experimental configuration. (B) Confocal image showing expression of shRNA (green) in TH+ (red) neurons. Arrowheads indicate absence of ALDH1a1 (blue) in GFP+/TH+ neurons. Scale bar: 20 µm. Representative oIPSC and oEPSC traces (C) and summary statistics (D) in DAT-Cre;Ai32 mice injected with Aldh1a1 knockdown and rescue viruses. Representative oIPSC and oEPSC traces (E) and summary statistics for oIPSC (F) and oEPSC (G) in Aldh1a1+/+;DAT-Cre;Ai32 or Aldh1a1−/−;DAT-Cre;Ai32 mice, or loss of function mice treated with DEAB (10 µM), and aminoguanidine (100 µM). Representative oIPSC and oEPSC traces (H) and summary statistics (I) recorded from Aldh1a1−/−;DAT-Cre;Ai32 mice injected with control and rescue viruses. Blue bar indicates 450 nm light stimulation. Scale bars: 400 pA, 100 ms for oIPSC and 50 pA, 100 ms for oEPSC. Error bars indicate Mean ± SEM. *P < 0.05, **P < 0.01, ***P < 0.001.

