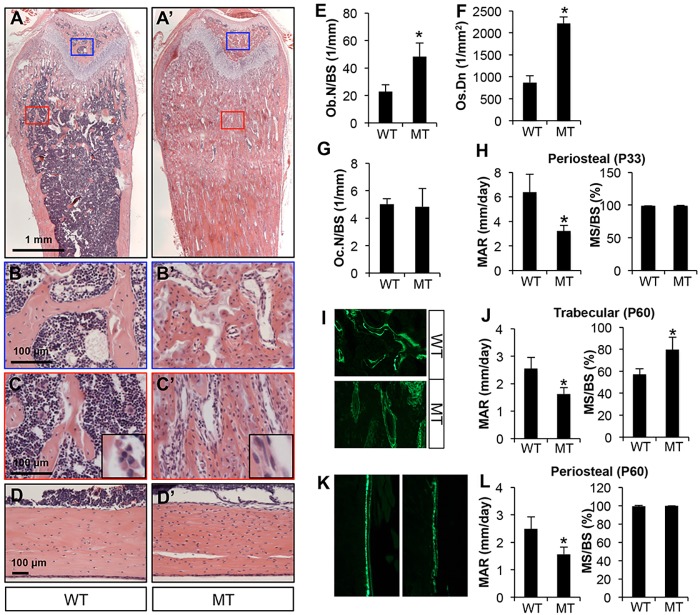
Fig. 3.
Bmpr1a deletion increases trabecular osteoblast number but reduces osteoblast activity. Mice were analyzed at P33 (A-H) or P60 (I-L). (A,A′) H&E staining of longitudinal sections of the femur. Blue or red boxes denote areas of secondary or primary ossification centers, respectively, shown at higher magnification beneath. (B,B′) Secondary ossification centers. (C,C′) Primary ossification centers. Insets show representative osteoblast morphology at higher magnification. (D,D′) H&E staining of longitudinal sections through the cortical bone of the femur. (E-G) Histomorphometric quantification of osteoblast number (Ob.N; E), osteocyte density (Os.Dn) in cortical bone (F) and osteoclast number (Oc.N; G), all in the femur. (H) Dynamic histomorphometry in the tibia. (I,K) Representative images of double labeling in the trabecular bone region (I) or periosteum (K) in the tibia. (J,L) Dynamic histomorphometric parameters in trabecular bone (J) or periosteum (L) in the tibia. WT, Bmpr1af/f; MT, Dmp1-Cre; Bmpr1af/f. *P<0.05, n=3. MS, mineralizing surface; BS, bone surface; MAR, mineral apposition rate.

