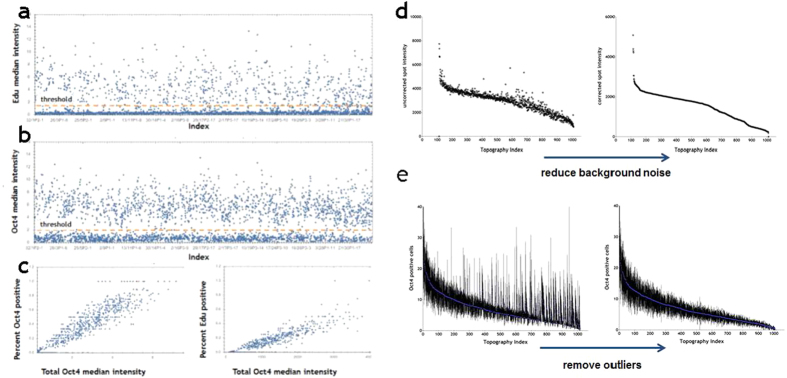
Figure 2. Quantitation of EdU+ and Oct4+ cells.
(a,b) Fluorescence intensity of individual cells is shown on y axes; x axes show individual TopoUnits. Position of thresholds for scoring individual cells as EdU+ (a) or Oct4+ (b) is shown. (c) Relationship between median Oct4 staining intensity and % Oct4+ or EdU+ cells on individual TopoUnits. R-values 0.1149 and 0.1188, respectively. (d,e) Effects of reducing background noise and outliers on ranking topographies according to the number of Oct4+ cells per TopoUnit. Signal was increased by removal of background noise (d) and outliers were defined as 2.5 SD away from mean (e).

