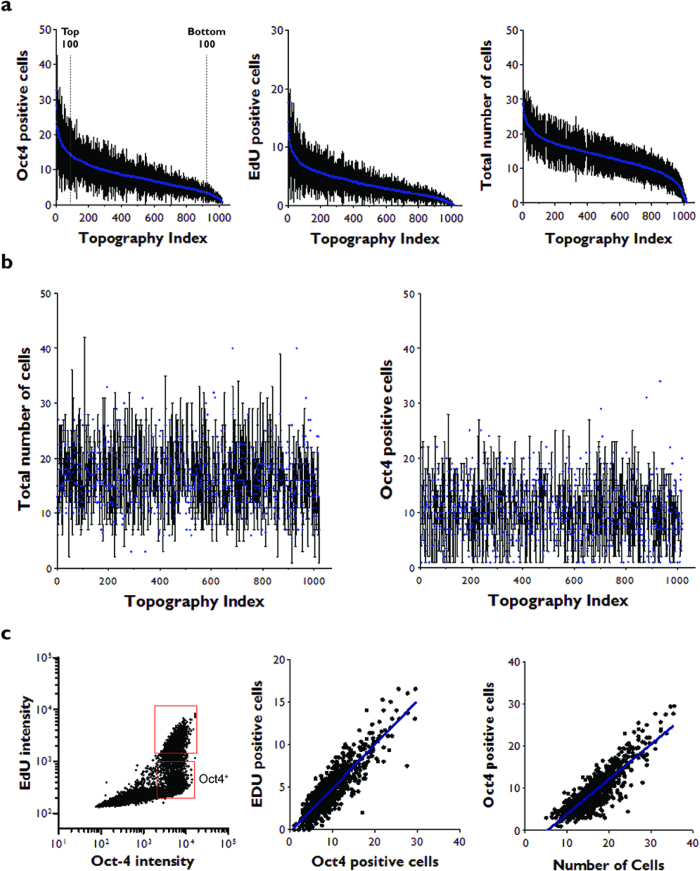
Figure 3. Human iPSC proliferation and Oct4 expression on distinct topographies.
(a) Topographies were ranked according to the total number of Oct4+ (left) or EdU+ cells (middle) or the total number of attached cells (right) at 24 h. Cutoffs for the 100 topographies with the highest and lowest number of Oct4 positive cells are shown. (b) Total number of cells (left) and number of Oct4+ cells (right) at 4 h. Topographies were ranked according to total number of Oct4+ cells at 24 h (a). (c) Fluorescence intensity thresholds were set for Oct4 (Oct4+) and EdU (EdU+) cells (Fig. 2) and the number of positive cells for each marker was determined. Left hand panel shows all the cells (individual dots) on a single TopoChip. Top gate contains EdU+ Oct4+ cells; bottom gate contains Oct4+ EdU− cells. Middle and right hand panels show all topographies (TopoUnits) on a single TopoChip. The R2 coefficient of determination values was calculated for positive correlations between Oct4+ and EdU+ cells (middle panel; R2 = 0.78), or Oct4+ cells and total cell number (right hand panel; R2 = 0.74).

