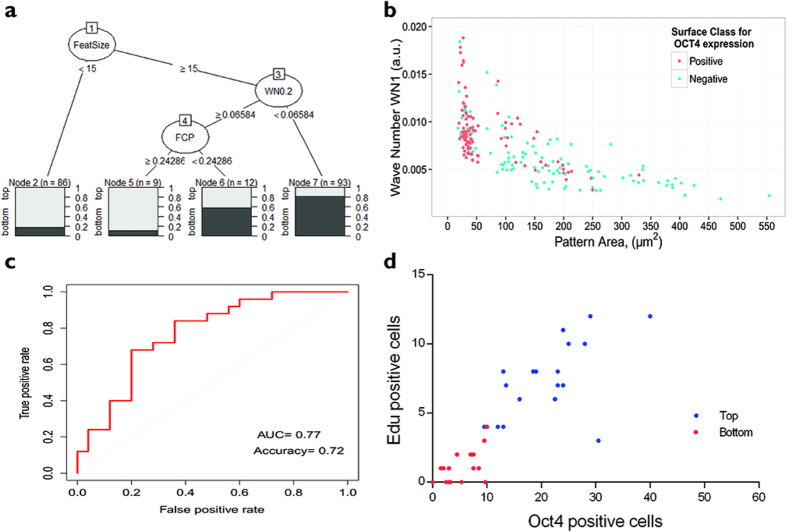
Figure 5. Identification of topography parameters that maintain proliferation and Oct4 expression.
(a) Regression tree showing sorting of topographies. After each node, the fraction of Positive (top 100 for Oct4+ cells) versus Negative (bottom 100 for Oct4+ cells) topographies is shown. (b) Scatter plot showing distribution of pattern area and wave number parameters for topographies with highest (red; top hits) and lowest (blue; bottom hits) number of Oct4+ cells. (c) ROC plot showing prediction performance for logistic regression model. (d) 30 TopoUnits that had not been analysed previously were predicted to promote Oct4 expression and EdU labelling (‘top hits’; blue) and a further 30 were predicted to be unable to support those characteristics (‘bottom hits’; red). Of those TopoUnits, 19 in the top category and 15 in the bottom category were analysed and confirmed experimentally.

