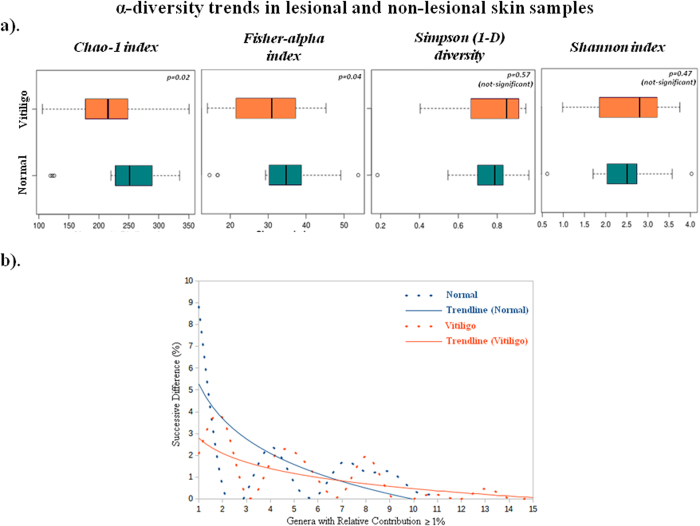
Figure 2. α-diversity trends in lesional and non-lesional skin samples.
(a) Boxplots illustrating the comparison of diversity indices (Chao-1, Fisher, Simpson1-D and Shannon index) between Non-Lesional and Lesional samples. (b) Comparison of differences between successive relative contribution values (of the ordered genera) in Non-Lesional and Lesional samples. Only those genera were considered for calculating successive differences in relative contributions that had a minimum relative contribution of 1%.

