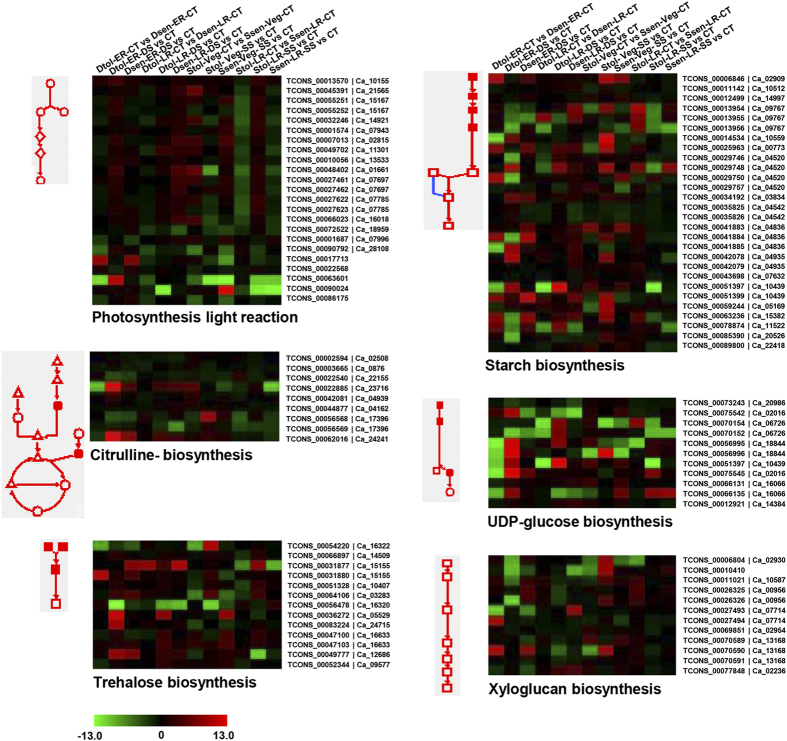
Figure 7. Regulation of metabolic pathways under drought and/or salinity stress conditions.
The major metabolic pathways significantly (P-value cut-off ≤0.05) enriched in differentially expressed genes are shown. Heatmaps showing the expression profiles of the transcripts involved in these pathways are also shown. The unique transcript (suffix TCONS) and gene locus identifier for each isoform have been given on the right side. The color scale at the bottom represents log2 fold change.

