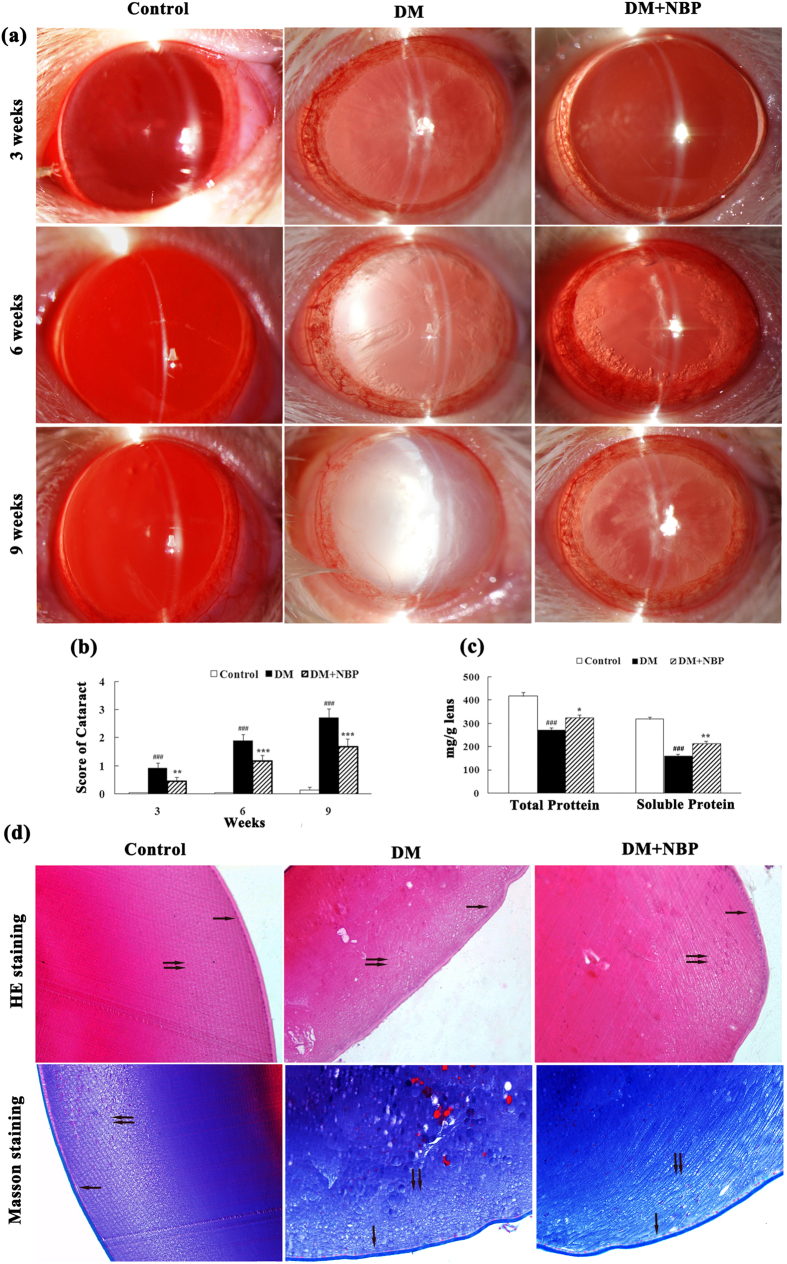
Figure 2. Formation and progression of cataract in different groups at different time point.
(a) Representative photographs of lenses at different time points. (Control, n = 15; DM, n = 13–15; DM + NBP, n = 12–15). (b) Average scores of cataract (Control, n = 15; DM, n = 13; DM + NBP, n = 12). (c) Lens total and soluble proteins of each group at nine weeks post-diabetes (n = 6 for each groups) (d) Representative histological photographs of lenses at nine weeks post-diabetes (n = 6 for each groups). The lenses tissue sections were stained with H&E and Masson and examined under a light microscope. One black arrow: lens epithelial cells; two black arrows: lens cortical region (magnification x200). Control: normal rats; DM: diabetic rats; DM + NBP: diabetic rats with NBP treatment. Data are expressed as mean ± SEM. ###P < 0.001 vs. Control; *P < 0.05 vs. DM; **P < 0.01 vs. DM; ***P < 0.001 vs. DM.

