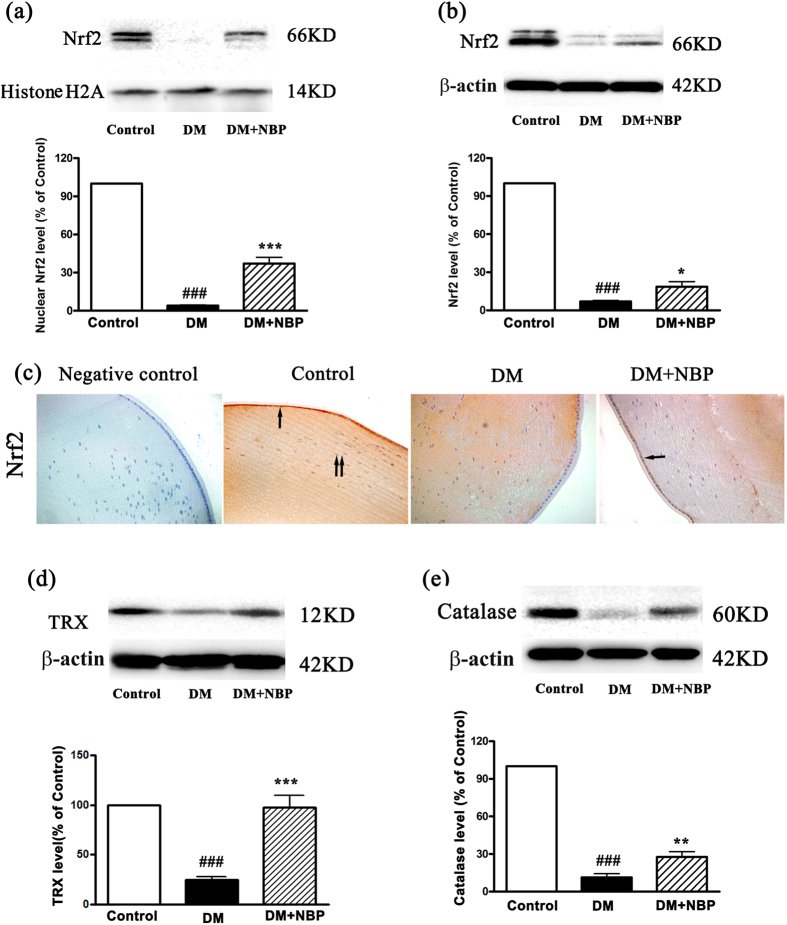
Figure 4. Expression of Nrf2,TRX and Catalase in the lens of rats at nine weeks post-diabetes.
(a) Relative levels of nuclear Nrf2 to histone-H2A by Western blot and quantitative analyses. This is a cropped blot and full-length blots are presented in Supplementary information Figure 3. (b) Relative levels of Nrf2 to β-actin by Western blot assays and quantitative analysis. This is a cropped blot and full-length blots are presented in Supplementary information Figure 4. (c) The expression of Nrf2 in the lens by immunochemistry. One black arrow: Positive Nrf2 staining in lens epithelial cells; two black arrows: Positive Nrf2 staining in fiber cells (magnification x200). (d) Relative levels of TRX to β-actin by Western blot assays and quantitative analysis. This is a cropped blot and full-length blots are presented in Supplementary information Figure 5. (e) Relative levels of Catalase to β-actin by Western blot assays and quantitative analysis. This is a cropped blot and full-length blots are presented in Supplementary information Figure 6. Control: normal rats; DM: diabetic rats; DM + NBP: diabetic rats with NBP treatment. Data shown are representative images or mean ± SEM of each group (n = 6). ###P < 0.001 vs. Control; *P < 0.05 vs. DM; **P < 0.01 vs. DM; 3***P < 0.001 vs. DM.

