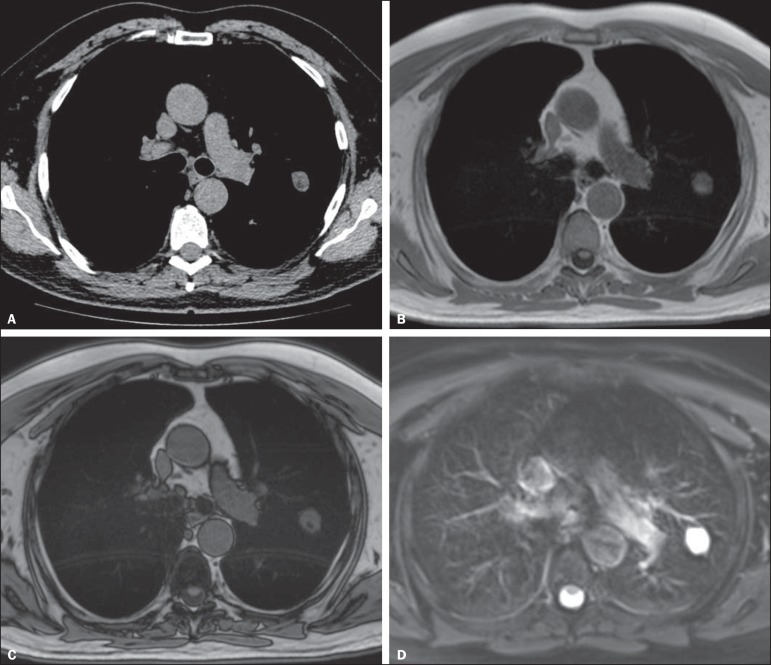
Figure 1.
A 56-year-old patient with pancreatic cancer. A: Axial CT image showing low attenuation areas inside the nodule. This nodule had mean -33 HU attenuation. In-phase (B) and opposed-phase (C) images showing signal loss in the nodule, suggesting hamartoma. D: T2-weighted sequence showing high signal intensity of the nodule.

