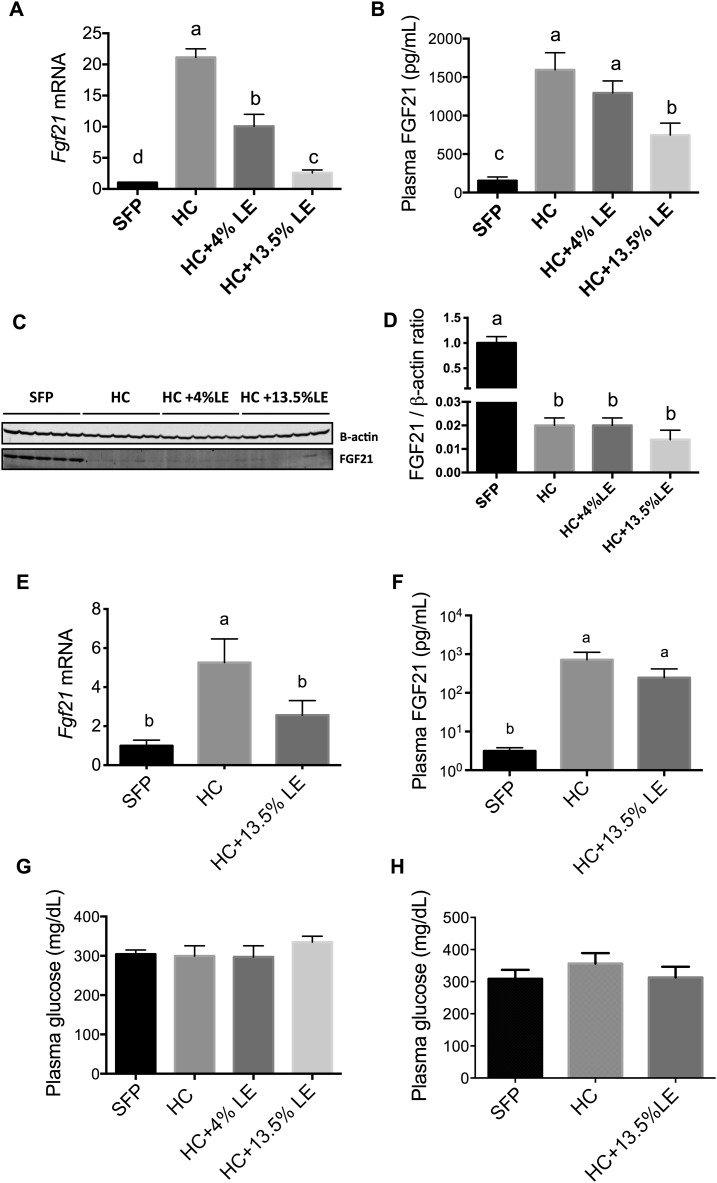
FIGURE 2.
Fgf21 mRNA expression (A, E) and FGF21 protein (C, D) in liver, FGF21 protein in plasma (B, F), and plasma glucose (G, H) in mice fed SFPs or a liquid HC diet alone or with an LE in Expt. 1 (5 wk) (A–D, G) and Expt. 2 (1 wk) (E, F, H). For qPCR data, values were first normalized to Gapdh mRNA for each sample; the mean for the SFP group was set to 1.0 for each experiment. Values are means ± SEMs, n = 5. One-factor ANOVA was used to compare the treatments. Different letters indicate differences between the treatment groups, P < 0.05. FGF21, fibroblast growth factor 21; HC, high-carbohydrate diet; LE, lipid emulsion; SFP, standard feed pellet.

