Abstract
Large differences between the concentrations of serum total carbon dioxide (TCO2) and blood gas bicarbonate (HCO3-) were observed in two consecutive simultaneously drawn sets of samples of serum and arterial blood gases in a patient who presented with severe carbon dioxide retention and profound acidemia. These differences could not be explained by the effect of the high partial pressure of carbon dioxide on TCO2, by variations in the dissociation constant of the carbonic acid/bicarbonate system or by faults caused by the algorithms of the blood gas apparatus that calculate HCO3-. A recalculation using the Henderson-Hasselbach equation revealed arterial blood gas HCO3- values close to the corresponding serum TCO2 values and clarified the diagnosis of the acid-base disorder, which had been placed in doubt by the large differences between the reported TCO2 and HCO3- values. Human error in the calculation of HCO3- was identified as the source of these differences. Recalculation of blood gas HCO3- should be the first step in identifying the source of large differences between serum TCO2 and blood gas HCO3-.
Keywords: total co2 concentration, bicarbonate concentration, carbonic acid/bicarbonate pk', acid-base status, acidemia, hypercapnia, respiratory acidosis, metabolic acidosis
Introduction
The measured total carbon dioxide (TCO2) in serum has three main components, bicarbonate anion (HCO3-), dissolved carbon dioxide (dCO2), and carbonic acid (H2CO3), which is the hydrated form of carbon dioxide. The concentration of dCO2 is calculated from the partial pressure of CO2 (pCO2). Not taking into account the concentration of H2CO3 in this calculation is the source of a negligible error. In body fluids, one H2CO3 molecule is at equilibrium with 340 molecules of dCO2 under normal temperature and physiologic conditions [1]. At a pH of 7.40, the concentration of HCO3- is 20-fold higher than the concentration of dCO2 and the concentration of H2CO3 is 1.2/340 or 0.004 mmol/L when the TCO2 concentration is 25.2 mmol/L and the HCO3- level is 24 mmol/L. The ratio HCO3-/dCO2 decreases progressively as the pH decreases but remains routinely high. Consequently, the concentrations of TCO2 in a serum sample and of HCO3- in a simultaneously drawn blood gas sample should differ only slightly, with TCO2 typically exceeding HCO3- by less than 3 mmol/L.
In a sample of blood gases, the concentration of dCO2 is expressed by multiplying the pCO2 by a proportionality coefficient S converting units of partial pressure to units of molar concentration. The value of HCO3- in blood gases is routinely obtained by entering the measured values of pH and pCO2 in an algorithm representing the Henderson-Hasselbach equation, the general expression of which is as follows:
pH = pK’ + log(HCO3-/[SxpCO2]) {1}
where pK’ is the negative logarithm of the first dissociation constant of H2CO3. The general expression of HCO3- concentration is obtained by rearranging equation 1 as follows:
HCO3- = SxpCO2x10(pH - pK) {2}
The coefficient S is not constant. The temperature and composition of the solution tested are factors affecting this coefficient. At body temperature, the coefficient S obtains the value 0.0301 mmol/L per mm Hg in blood [1]. The pK’ of H2CO3 in aqueous solutions is around 3.5 [2]. The calculation of this pK’ in biological fluids assumes that H2CO3 consists of the whole dCO2. Therefore, the apparent value of pK’ is at or very close to 6.1 under normal conditions [1].
Large differences between simultaneously obtained concentrations of serum TCO2 and arterial blood HCO3- are encountered in certain instances. These differences complicate the evaluation of the acid-base status of patients and may lead to diagnostic and therapeutic errors. One potential source of the discrepancy is rooted in the erroneous assumption that the pK’ of H2CO3 is constant at 6.1. It was suggested that this pK’ is the cause of erroneous calculation of HCO3- in blood gases [3].
Differences in the concentrations of closely obtained TCO2 and HCO3- may have other origins in addition to a wrong value of pK’ applied in the calculation of HCO3-. A systematic search for the cause of these differences is merited. We report a patient presenting with a large difference between serum TCO2 and arterial blood gas HCO3- in two consecutive sets of serum and blood gas samples. By our calculations, the pK’ was not the cause of this difference. A different reason for the difference was detected and led to the correct diagnosis of the acid-base disturbance, which was in doubt because of the TCO2/HCO3- discrepancy.
Case presentation
Patient
Permission to report this case was obtained from the Raymond G Murphy VA Medical Center Institutional Human Research Committee. This paper was approved as a case report with waiving of the informed consent with the proviso that all identifying information was removed from the text.
A 61-year-old man with acute confusion and shallow and infrequent respirations was transferred to this hospital from a nursing home. He carried the diagnosis of alcoholic cirrhosis with ascites. One year prior to this admission, he had a small bowel resection with ileostomy. Six months later, he had surgical repair of an incarcerated inguinal hernia.
In the days prior to admission, he had consumed an unknown number of oxycodone tablets. On admission, his temperature was 36.9° C, blood pressure - 132/68 mm Hg, and pulse rate - 89 per minute. Urine toxicology revealed large concentrations of opioids. Acute respiratory failure was diagnosed. He underwent tracheal intubation and was ventilated. Table 1 shows arterial blood acid-base parameters and serum TCO2 in the first two sets of simultaneously drawn samples of arterial blood gases and serum. Arterial blood gas values were determined in a satellite “point-of-care” instrument almost immediately after collection of the samples. The concentration of serum TCO2 exceeded that of arterial blood gas HCO3- by 10.7 mmol/L in the first set of blood samples and by 7.6 mmol/L in the second set. In the first and second serum samples, respectively, sodium concentrations were 139 and 138 mmol/L, chloride concentrations were 102 and 103 mmol/L, and anion gaps were 8 and 9 mEq/L. Lactate level was 1.1 mmol/L in the first blood sample.
Table 1. Reported simultaneously obtained serum and arterial blood gas acid-base parameters .
| Study | Arterial pH | Arterial pCO2 mm Hg | Arterial HCO3- mmol/ | Serum TCO2 mmol/L |
| 1st | 6.91 | 149 | 18.3 | 29.0 |
| 2nd | 7.11 | 74 | 18.4 | 26.0 |
The patient’s respiratory acidosis improved rapidly with ventilation. He was extubated the next day. His mental status improved slowly and returned to baseline in four days. The concentration of serum TCO2 was between 24 and 27 mmol/L in samples obtained after the first two samples during this hospitalization.
Investigations of the source of the discrepancy between TCO2 and HCO3-
Identification of the source of the difference between serum TCO2 and arterial blood HCO3- was attempted in three successive steps:
The Potential Effect of Elevated pCO2
The concentration of TCO2 is considered at first approximation to be equal to the sum of the concentrations of dCO2 and HCO3-. Because it is a linear function of pCO2, dCO2 accounts for progressively larger differences between serum TCO2 and HCO3- at progressive levels of hypercapnia. We tested whether dCO2, calculated as 0.0301XpCO2, accounted for the differences between serum TCO2 and blood gas HCO3- in our patient. Figure 1 shows this comparison for the first set of measurements. The figure shows the sum of blood gas HCO3-, dCO2, and H2CO3 in an idealized normal subject with an HCO3- of 24 mmol/L and a dCO2 of 1.2 mmol/L and in the first set of arterial blood gases in the patient of this report, plus the measured TCO2 in the first blood sample of this patient.
Figure 1. Components of total carbon dioxide content.
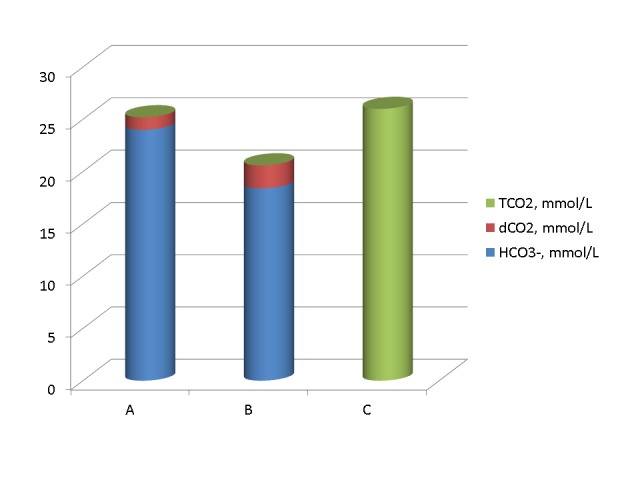
A: Idealized normal subject. B: Arterial blood gas dCO2, plus H2CO3, plus HCO3- in the first set of blood tests in the patient presented in this report. C: Serum TCO2 in the first set of blood tests in the patient of this report. The concentration of arterial dCO2 was substantially higher in B than in A. Despite adjustment for the high dCO2, the measured concentration of TCO2 in serum (C) remained substantially higher than its computed concentration in the blood gasses (B).
Figure 2 shows the comparison between the sum of blood gas HCO3- , dCO2, and H2CO3, plus the measured serum TCO2 in the second set of measurements and in the idealized normal subject.
Figure 2. Components of total Carbon dioxide content.
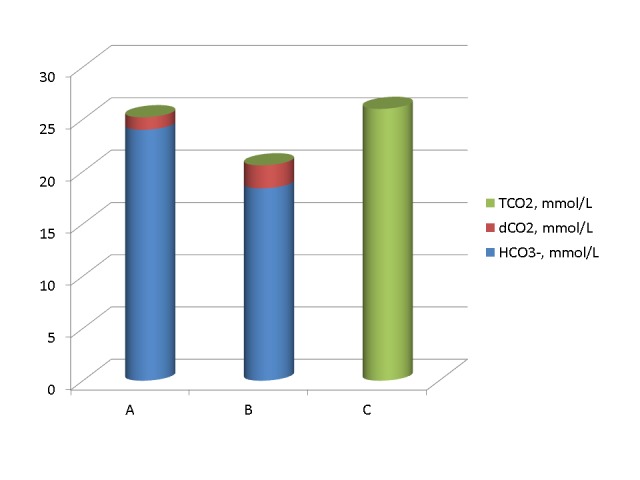
A. Idealized normal subjects. B. Arterial blood gas HCO3-, plus dCO2, plus H2CO3 in the second set of blood tests in the patient of this report. C. Measured serum TCO2 in the second set of blood tests in the patient of this report. The measured serum TCO2 (C) remained substantially higher than the calculated blood gas TCO2 (B).
Figures 1 and 2 have two noticeable findings. The first finding is that the concentration of H2CO3 was truly negligible. The concentration of H2CO3 should be shown in red. Red colour columns did not appear in the figures even at a pCO2 of 149 mm Hg. The main finding of Figures 1 and 2 is that accounting for dCO2 reduced the difference of the concentrations between serum TCO2 and arterial blood HCO3- but did not eliminate it. Substantial parts of this difference remained unaccounted for.
Potential Effect of Changing pK’
The pK’ of H2CO3 in various solutions is not a fixed value. Variables affecting this pK’ include the temperature, acidity, and ionic strength of the solution tested [3-7]. The first two variables have been studied extensively [3-6]. The pK’ value increases with increasing acidity and decreasing temperature. Increasing the pK’ value in equation 2 lowers the value of HCO3- calculated from it for the same value of pCO2. In the chapter by Madias and Cohen [1], Table 1-3 shows apparent pK’ values in human plasma at temperatures between 10 and 40° C and pH values between 7.0 and 7.6. In this table, the lowest plasma pK’, at a pH of 7.60 and a temperature of 40° C, was 6.077 while the highest pK’, at a pH of 7.00 and a temperature of 10 °C, was 6.246. Figure 3 shows the values of HCO3- calculated from equation 2 for a pCO2 of 149 mm Hg and pK’ values of 6.1, 6.077, and 6.246. The figure shows substantial differences between these values. The lowest value of HCO3- was calculated for a pK’ of 6.246 and the highest value for a pK’ of 6.077.
Figure 3. Bicarbonate values calculated at a pH of 6.91 from a pCO2 of 149 mm Hg by various pK' values.
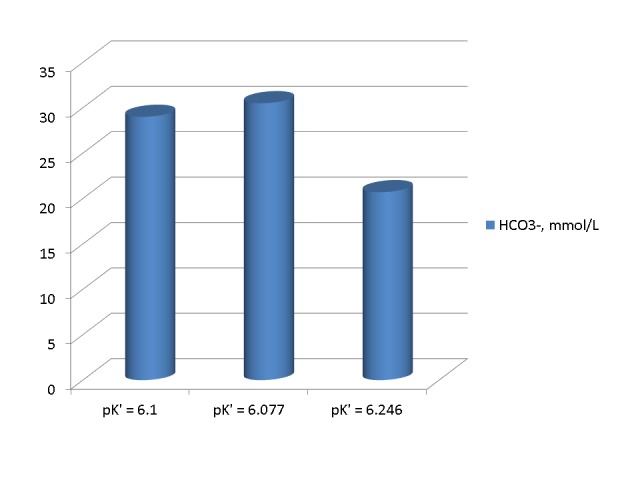
High pK' values, observed at low temperatures and low pH values result in low values of calculated HCO3-.
The purpose of Figure 3 was to show the direction of the changes in the HCO3- concentration that result exclusively from changes in the pK’. Consequently, the pH was kept at 6.91 and the temperature was kept at 37° C in all three calculations. Correction for the effect of temperature on the pCO2 and use of the correct pK’ for each temperature and pH in equation 2 would change the differences shown in this figure and could potentially increase them. Therefore, a variation in the pK’ can potentially account for large variations in HCO3- and large differences between serum TCO2 and blood gas HCO3-.
We tested the effect of changing pK’ on the differences between serum TCO2 and arterial blood gas HCO3- in the patient presented in this report in two sets of calculations. In the first set, we repeated the calculations of HCO3- using a pK’ of 6.1 by the following equation:
HCO3- = 0.0301xpCO2x10(pH – 6.1) {3}
In the second set of calculations, we calculated the approximate pK’ value at a pH of 6.91 by performing a linear regression on pH and pK’ values at a temperature of 37° C in Table 1-3 of the chapter by Madias and Cohen [1]. We obtained the following regression: pK’ = 6.410 – 0.042xpH, r = -0.994. The pK’ values calculated by this regression are 6.120 for a pH of 6.91 and 6.114 for a pH of 7.11. Figure 4 shows HCO3- values reported and calculated from equations 3 and 2 for pK’ values of 6.1 and 6.120 in the first set of measurements. The calculated values were substantially higher than the reported HCO3- value and very close to each other and the measured serum TCO2 of 29 mmol/L.
Figure 4. Bicarbonate concentrations in the first arterial blood sample reported and calculated by the use of three different pK' values .
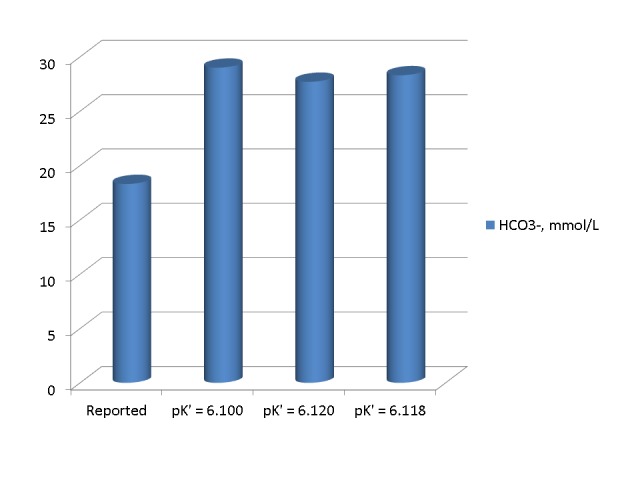
The three calculated HCO3- values were substantially higher than the reported value and very close to each other and to the measured serum TCO2.
Figure 5 shows HCO3- values reported and calculated from equations 3 and 2 for pK’ values of 6.1 and 6.114 in the second set of measurements. Again, the calculated values were substantially higher than the reported HCO3- value and very close to each other and the measured serum TCO2 of 26 mmol/L.
Figure 5. Bicarbonate concentrations in the second set of arterial blood gasses reported and calculated by three different pK'.
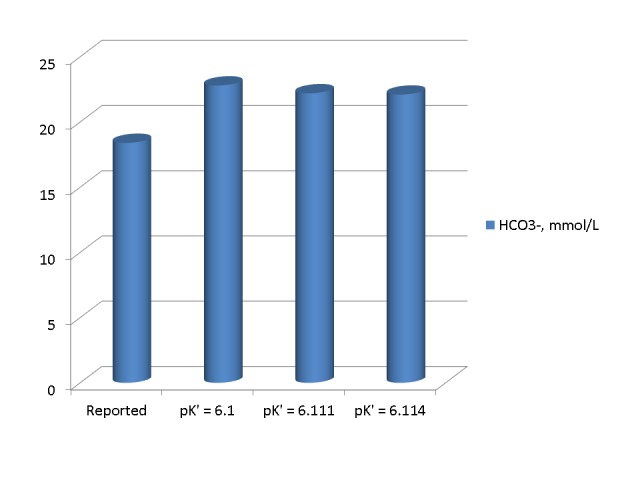
In the first and second set of blood gasses alike, the calculated HCO3- values were substantially higher than the reported value and very close to each other and to the corresponding measured serum TCO2.
The pK’ value that is required to obtain an HCO3- of 18.3 mmol/L, calculated from the Henderson-Hasselbach equation for a pCO2 of 149 mm Hg and a pH of 6.91 is 6.299, a value substantially higher than any of the values provided in the table published by Madias and Cohen [1]. From equation 1, the pH value required for the calculation of an HCO3- of 18.3 mmol/L at a pCO2 of 149 mm Hg is 6.71 when the pK is 6.1. We concluded that it is unlikely that the observed difference between serum TCO2 and arterial blood HCO3- was due to variation in the value of pK’.
Potential Effect of Instrument Calibration Error or Human Error
From the previous calculations, we concluded that the reported blood gas HCO3- values were in error. The similarity of the calculated blood gas HCO3- values in the first and second sets of measurements suggested a possibility that the error may be in the algorithms of the blood gas apparatus. We investigated whether the error in the calculations of HCO3- was due to issues related to the blood gas apparatus or to errors of the operators of the blood gas apparatus by repeating the calculations using the logarithms for the pK' and HCO3- calculations shown in the manual of the apparatus. At a temperature of 37° C, the pK’ values calculated by these algorithms are 6.118 for a pH of 6.91 and 6.114 for a pH of 7.11. Figures 4 and 5 show the calculated blood gas HCO3- values in the first and second set of measurements by the use of these pK’ values. These values are also very close to the other calculated values and the values of the reported serum TCO2. We concluded that the error in the reported HCO3- values cannot be attributed to the algorithms of the blood gas apparatus.
Discussion
Acid-base disorders indicate health challenges that must be addressed because they result from profound respiratory or metabolic derangements and can be life-threatening. The first step in the management of an acid-base disorder is a correct diagnosis based on accurate measurement or calculation of the acid-base determinants in the blood and on the proper interpretation of these determinants [8]. The diagnosis is based on the observed combination of the measured value of blood pH and the measured or computed values of the pivotal carbonic acid/bicarbonate buffer system [9]. The patient presented in this report illustrates the difficulty encountered when measured and computed acid-base parameters lead to different diagnostic acid-base categories. A pathway leading to deciphering this difficulty is detailed.
In the first two sets of serum and arterial blood gas measurements of our patient, substantial differences were found between the reported concentrations of serum TCO2 and arterial blood HCO3- (Table 1). These differences created differing impressions of the underlying acid-base disorder. The arterial blood gases suggested a picture of mixed respiratory and metabolic acidosis while the combination of arterial pH and pCO2, plus serum TCO2, indicated acute respiratory acidosis alone [10]. Previous medical history assists in the diagnosis of acid-base disorders [9]. In our patient, previous extensive gut surgery could have been the cause of metabolic acidosis, but his mental status on admission did not allow questioning about recent bowel movements. In any event, the critical issue in this and all other cases with similar findings is an identification of the correct one among the two conflicting acid-base parameters. Variations in the pK’ of the carbonic acid/bicarbonate system have been extensively studied as a source of TCO2/HCO3- differences.
Variation of pK’ with temperature and acidity of the biological fluid tested was documented in both humans [3-6] and animals [11-12]. It was reported that variation in the pK’ values results in substantial variation of the HCO3- values calculated by the Henderson-Hasselbach equation [13]. Observed differences between serum TCO2 and HCO3- values calculated by using the Henderson-Hasselbach equation with the pK’ fixed at 6.1 were attributed to errors in the value of HCO3- secondary to varying pK’ [14-20]. This approach suggests that the correct acid-base value for diagnosing the acid-base disorder and assessing its magnitude is the serum TCO2, the measurement of which is not affected by changes in pK’.
The concept that the bicarbonate/carbonic acid pK’ is the main cause of discrepancies between serum TCO2 and blood gas HCO3- has been challenged [21]. One criticism of this concept is that the scale of the pK’ change that has been calculated for changes in blood acidity and temperature is not large enough to explain large differences between TCO2 and HCO3- [22]. As noted, higher values of pK’ resulting from high acidity or low temperature of the solution tested lead to lower values of HCO3- calculated by the Henderson-Hasselbach equation. Studies in critically ill patients found only a small variation of the pK’ around 6.1 [23-26]. These studies suggest that varying pK’ is not the cause of large differences between TCO2 and HCO3-.
Another potential source of differences between serum TCO2 and blood gas HCO3- is an analytical overestimation of TCO2 [27]. TCO2 is measured by converting at a temperature of 37° C essentially all CO2 in the tested sample to HCO3- by a complex enzymatic method producing NAD+ from a known substrate of NADH under the influence of HCO3-. The remaining NADH is measured by reflectance spectrophotometry [28]. A large list of tested medications and organic compounds showed no interference with this assay [29]. However, overestimation of TCO2 was reported in some cases and was attributed to interference by organic acids or carbamino compounds [30-31]. Based on this interpretation of the source of differences between serum TCO2 and blood gas HCO3-, Halperin and coauthors proposed that these differences are not caused by variations in the pK’ and that the level of HCO3-, rather than that of TCO2, is the correct measurement [32]. In a recent case report, serum TCO2 was consistently low in a patient with normal blood pH and HCO3- [33]. The presence in the patient’s serum of paraproteins causing turbidity and interfering negatively with the enzymatic measurement of TCO2 was identified as the source of the erroneously low TCO2 values in this report.
We evaluated the pK’ as the potential source of the difference between serum TCO2 and blood gas HCO3- in the patient presented in this report. The arterial blood pH in the first set of measurements, at 6.91, was lower than the lowest pH value in Table 1-3 of the Madias and Cohen chapter [1]. We calculated the pK’ value for a pH of 6.91 by performing a linear regression of pH on the pK’ values reported in the same table at a temperature of 37 °C. An apparent linearity of the relationship pK’/pH within “physiologic” pH values has been reported [34]. Changing ionic strength is the source of a curvilinear relationship pK’/pH [7]. However, the ionic strength of the blood of our patient was within normal limits. The slope of the pK’/pH regression that we performed was, at -0.042, within the range of slopes (-0.05 to -0.04) reported in the literature [17]. The pK’ values that we calculated were almost identical to the values calculated by the algorithms of the blood gas apparatus. HCO3- values calculated using a pK’ of 6.1 and pK’ values calculated from our pH/pK’ regression analysis of the Madias and Cohen Table 1-3 and from the algorithms of the blood gas apparatus were very close to each other and to the corresponding serum TCO2 values clarifying the diagnosis of the acid-base disorder and identifying human error as the source of the observed TCO2/HCO3- differences.
Based on the closeness of the HCO3- values calculated by using a pK’ of 6.1 and pK’ values obtained by other methods, we propose that the first step in identifying the source of large TCO2/HCO3- differences should be a recalculation of the blood gas HCO3- value using equation 3 with a pK’ of 6.1. This calculation is simple and will provide an easy answer to the question of error. If large differences TCO2/HCO3- persist after the first recalculation of the blood gas HCO3-, the second step, only in severe hypercapnia, should be to calculate the dCO2 as 0.0301xPCO2. Persistence of large TCO2/HCO3- differences should lead to a new calculation of the HCO3- using the algorithms of the blood gas apparatus because they may still reveal substantial differences in extreme acid-base disturbances. Persisting differences, unexplained by changes in pK’ or pCO2, require a systematic investigation of the timing of blood gas and serum samples in patients with unstable acid-base status and investigation of the handling of the blood samples, with emphasis on the blood gas sample (temperature, time period between drawing and measuring the sample, etc). If sampling issues are discovered, a new simultaneous set of blood gases and serum samples should be obtained. If differences persist in this new set, conditions affecting the measurement of TCO2 should be investigated [30-31, 33].
Conclusions
Neither a variation in the apparent carbonic acid pK’, nor a high PCO2 value appears to provide adequate explanations for very large differences between measured serum TCO2 and calculated blood gas HCO3-. Although analytical errors in the measurement of TCO2 may be present, the possibility of error in the input of values into the blood gas apparatus or in reporting acid-base parameters should be evaluated first. The first, and simple, step in identifying the source of large differences between serum TCO2 and blood gas HCO3- is an independent verification of the calculation of HCO3- using a pK’ of 6.1. Equation 3 should be used as the algorithm for this calculation.
The content published in Cureus is the result of clinical experience and/or research by independent individuals or organizations. Cureus is not responsible for the scientific accuracy or reliability of data or conclusions published herein. All content published within Cureus is intended only for educational, research and reference purposes. Additionally, articles published within Cureus should not be deemed a suitable substitute for the advice of a qualified health care professional. Do not disregard or avoid professional medical advice due to content published within Cureus.
The authors have declared that no competing interests exist.
Human Ethics
Raymond G Murphy VA Medical Center IRB issued approval. Approved as a case report with waiving of informed consent with the proviso that all identifying information is removed from the text
References
- 1.Madias NE, Cohen JJ. Acid-Base. Boston: Little, Brown and Company; 1982. Acid-base chemistry and buffering; pp. 3–24. [Google Scholar]
- 2.Aqueous carbonic acid (H2CO3) Loerting T, Bernard J. ChemPhysChem. 2010;11:2305–2309. doi: 10.1002/cphc.201000220. [DOI] [PubMed] [Google Scholar]
- 3.Variations of serum carbonic acid pK with pH and temperature. Bradley AF, Severinghaus JW, Srupfel M. J Appl Physiol. 1956;9:187–200. doi: 10.1152/jappl.1956.9.2.197. [DOI] [PubMed] [Google Scholar]
- 4.The pK' of carbonic acid in cerebrovascular fluid. Alexander SC, Gelfand R, Lambertsen CJ. J Biol Chem. 1961;236:592–596. [PubMed] [Google Scholar]
- 5.The determination of the true equilibrium constant (pK 1g) and the practical equilibrium coefficient (pK 1g) for the first ionization of carbonic acid in solutions of sodium bicarbonate, cerebrospinal fluid, plasma and serum at 25 and 38. Maas AH, van Heijst AN, Visser BF. Clin Chim Acta. 1971;33:325–343. doi: 10.1016/0009-8981(71)90490-6. [DOI] [PubMed] [Google Scholar]
- 6.Apparent change in the pK1 of carboinic acid in plasma in response to acute metabolic acidosis in normal subjects. Wills MR, Laite PA. Clin Chim Acta. 1971;35:514–516. doi: 10.1016/0009-8981(71)90233-6. [DOI] [PubMed] [Google Scholar]
- 7.Best literature values for the pK of carbonic and phosphoric acid under physiological conditions. Jungas RL. Anal Biochem. 2006;349:1–15. doi: 10.1016/j.ab.2005.08.020. [DOI] [PubMed] [Google Scholar]
- 8.Assessing acid-base disorders. Adrogue HJ, Gennari FJ, Galla JH, Madias NE. Kidney Int. 2009;76:1239–1247. doi: 10.1038/ki.2009.359. [DOI] [PubMed] [Google Scholar]
- 9.Harrington JT, Cohen JJ, Kassirer JP. Acid-Base. Boston: Little, Brown and Company; 1982. Introduction to the clinical acid-base disturbances; pp. 113–120. [Google Scholar]
- 10.Carbon dioxide titration curve of normal man. Effect of increasing degrees of hypercapnia on acid-base equilibrium. Brackett NC Jr, Cohen JJ, Schwartz WB. N Engl J Med. 1965;272:6–12. doi: 10.1056/NEJM196501072720102. [DOI] [PubMed] [Google Scholar]
- 11.The imprecision arising from the application of the Henderson-Hasselbalch relationship to the blood of anesthetized dogs. Linden RJ, Norman J. J Physiol. 1971;215:491–507. doi: 10.1113/jphysiol.1971.sp009481. [DOI] [PMC free article] [PubMed] [Google Scholar]
- 12.The apparent pK of carbonic acid in rainbow trout blood plasma between 5 and 15 degrees C. Boutilier RG, Iwama GK, Heming TA, Randall DJ. Respir Physiol. 1985;61:237–254. doi: 10.1016/0034-5687(85)90129-x. [DOI] [PubMed] [Google Scholar]
- 13.Calculation of plasma bicarbonates using Henderson-Hasselbalch equation. Influence of pK changes as a function of pH (article in Italian) Agabiti E, Todisco T, Grassi V, Sorbini CA. Minerva Nefrol. 1973;20:23–27. [PubMed] [Google Scholar]
- 14.The use of the Henderson-Hasselbach equation in routine clinical practice. Sinclair MJ, Hart RA, Pope HM, Campbell EJM. Clin Chim Acta. 1968;19:63–69. [Google Scholar]
- 15.Comparison of calculated and experimental pCO2 values. Tietz NW. Ann Clin Lab Sci. 1973;3:341–344. [PubMed] [Google Scholar]
- 16.Effect of the variation of pK' of the Henderson-Hasselbach equation on values obtained for total CO2 calculated from pCO2 and pH values. Natelson S, Nobel D. Clin Chem. 1977;23:767–769. [PubMed] [Google Scholar]
- 17.Is pK OK? Hood I, Campbell EJM. N Engl J Med. 1982;306:864–866. doi: 10.1056/NEJM198204083061410. [DOI] [PubMed] [Google Scholar]
- 18.Unpredictable error in calculated bicarbonate homeostasis during pediatric intensive care: the delusion of fixed pK'. Rosan RC, Erlander D, Ellis J. Clin Chem. 1983;29:69–73. [PubMed] [Google Scholar]
- 19.Effects of pK variability on bicarbonate balance in dialysis patients. Santoro A, Ferrari G, Spongano M, Cavali F, Zucchelli P. Artif Organs. 1987;11:491–495. doi: 10.1111/j.1525-1594.1987.tb02715.x. [DOI] [PubMed] [Google Scholar]
- 20.Base excess significantly corrected for the variations in apparent dissociation constant for human blood gas testing. Rana AP, Rana SP, Rana JP, Kaur T. Indian J Physiol Pharmacol. 2006;50:303–308. [PubMed] [Google Scholar]
- 21.Further comments on the vatiation of pK': computation of [HCO3-] independent of pK' and solubility coefficient. Austin WH. Clin Chem. 1978;24:1081–1082. [PubMed] [Google Scholar]
- 22.Is pK OK? (Letter) Gennari FJ. N Engl J Med. 1982;307:683. [Google Scholar]
- 23.Evaluation of whole blood pK' in the acutely ill patient. Austin WH, Ferrante V, Anderson C. J Lab Clin Med. 1968;72:129–135. [PubMed] [Google Scholar]
- 24.Direct and indirect determination of partial pressure of CO2 in the arterial blood of patients with respiratory insufficiency. De Raedt M, Vandenbergh E, Van de Woestijne KP. Clin Sci. 1968;35:347–352. [PubMed] [Google Scholar]
- 25.Is pK OK? Ryan DH, Holt J. N Engl J Med. 1982;307:683–684. [Google Scholar]
- 26.Constancy of blood carbonic acid pK' in patients during cardiopulmonary resuscitation. Kruse JA, Hukku P, Carlson RW. Chest. 1988;93:1221–1224. doi: 10.1378/chest.93.6.1221. [DOI] [PubMed] [Google Scholar]
- 27.Failure of the serum CO2 determined by automation to estimate the plasma bicarbonate. Mohler JG, Mohler PA, Pallivathucal RG. Scand J Clin Lab Invest Suppl. 1987;188:61–67. [PubMed] [Google Scholar]
- 28.Ortho-Clinical Diagnostics. Corning 965 Carbon Dioxide Analyzer Manual. Medfield, Massachusets: Corning Medical; [Oct;2015 ]. 1977. Instructions for use ECO2; pp. 1–10. [Google Scholar]
- 29.Krower JS, Tholen DW, Garber CC, Goldshmidt HMJ, Kroll MH, Linnet K, Meier K, Robinowitz M, Kennedy JW (NCCLS Document EPG9-A2) Method Comparison and Bias Estimation Using Patient Samples: Approved Guideline. Wayne, PA: CLSI; 2002. Method Comparison and Bias Estimation Using Patient Samples: Approved Guideline, 2nd edition. [Google Scholar]
- 30.Calculated bicarbonate or carbon dioxide? O' Leary TD, Langton SR. Clin Chem. 1989;35:1697–1700. [PubMed] [Google Scholar]
- 31.Influence of solutes in plasma on the total CO2 content determination: implications for clinical disorders. Pichette C, Chen CB, Goldstein M, Stinebaugh B, Halperin M. Clin Biochem. 1983;16:91–93. doi: 10.1016/s0009-9120(83)90552-0. [DOI] [PubMed] [Google Scholar]
- 32.Evaluation of the bicarbonate buffer system. Does the pK' really vary in the blood? Halperin M, Goldstein MB, Pichette C, Jungas RL, Stinebaugh BJ. Am J Nephrol. 1983;3:245–247. doi: 10.1159/000166723. [DOI] [PubMed] [Google Scholar]
- 33.Pseudohypocarbonatremia caused by an endogenous assay interferent: a new entity. Goldwasser P, Manjappa NG, Luhrs CA, Barth RH. Am J Kidney Dis. 2011;58:617–620. doi: 10.1053/j.ajkd.2011.06.003. [DOI] [PubMed] [Google Scholar]
- 34.The effect of variation in ionic strength on the apparent first and second dissociation constant of the carbonic acid. Hastings AN, Sendroy J Jr. J Biol Chem. 1925;65:445–455. [Google Scholar]


