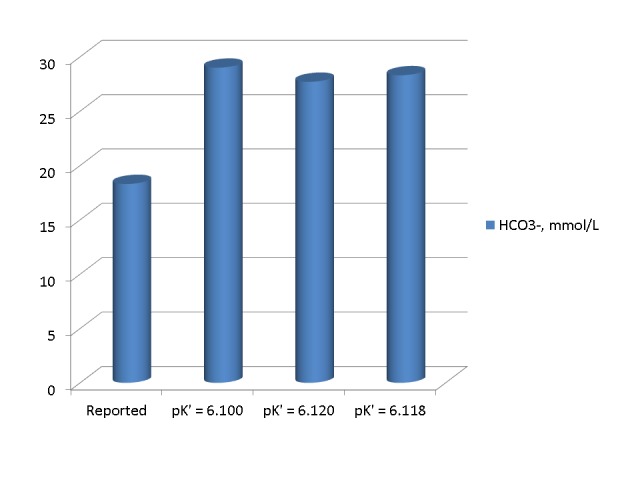
Figure 4. Bicarbonate concentrations in the first arterial blood sample reported and calculated by the use of three different pK' values .

The three calculated HCO3- values were substantially higher than the reported value and very close to each other and to the measured serum TCO2.
