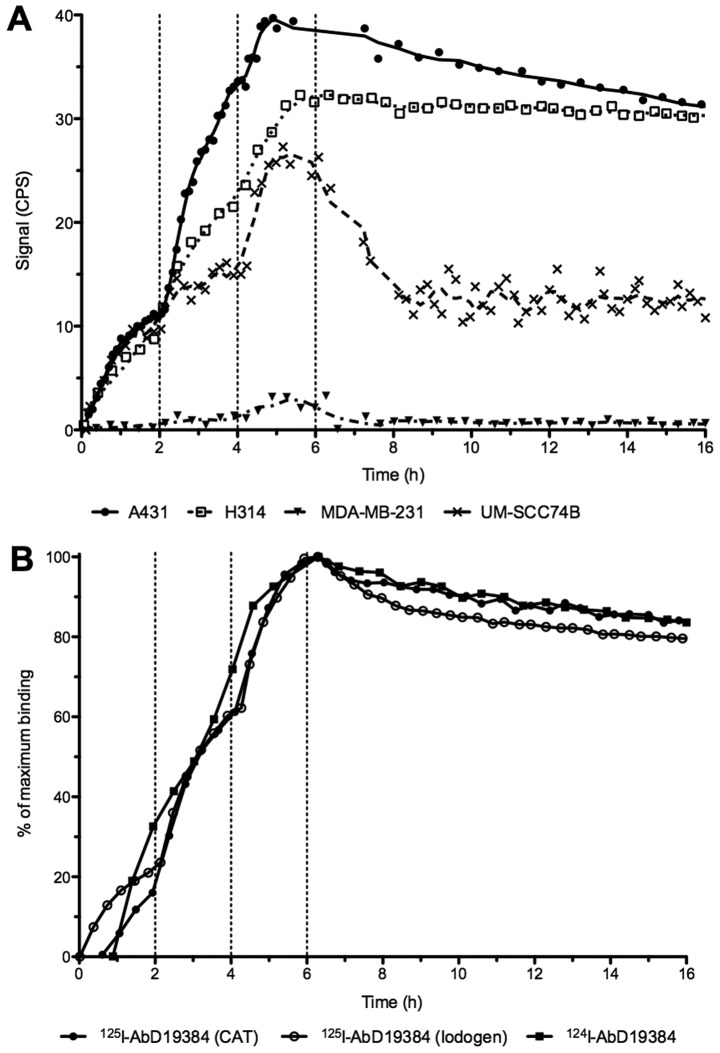
Figure 2.
Representative LigandTracer measurements of real-time binding. Binding traces using three subsequent concentrations (10, 30 and 90 nM) were obtained for at least 1 h per concentration (marked by vertical dotted lines), followed by a dissociation measurement for at least 15 h. (A) Binding of 125I-AbD19384 to cell lines of various CD44v6 density. Signal is shown as counts per second (CPS). (B) Comparison of iodinated AbD19384 conjugates on A431 cells. Curves were normalized to percentage of maximum binding.

