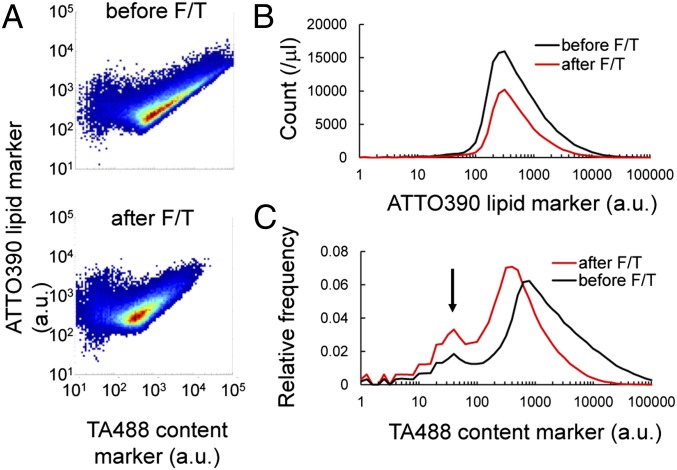
Fig. 2.
Size distribution and content leakage of liposomes before (before F/T) and after freeze-thaw (after F/T). (A) 2D plots of liposome fluorescence before and after F/T. The horizontal axis shows TA488 content marker fluorescence, and the vertical axis shows ATTO390 lipid marker fluorescence. (B) Histogram of ATTO390 lipid marker fluorescence. The vertical axis shows the liposome number measured by FCM in 1 μL of liposome solution. (C) Histogram of TA488 content marker fluorescence. The arrow indicates the particles without significant aqueous content. The vertical axis shows the relative frequency.

