Fig. 5.
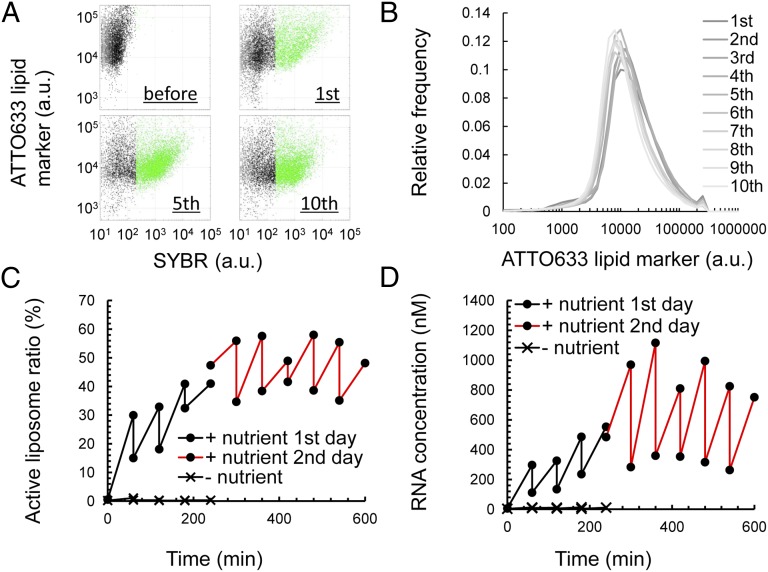
Repetitive culturing of RNA-replicating liposomes. (A) 2D plots of fluorescence measured by FCM. Liposomes (before) were F/T-ed with nutrient liposomes and incubated for 1 h (first). F/T with nutrient liposomes was repeated for 10 cycles. The plots of liposomes incubated after the 5th and 10th F/T are also shown. The horizontal axis shows SYBR fluorescence (RNA content), and the vertical axis shows ATTO633 lipid marker fluorescence. (B) Histogram of ATTO633 lipid marker fluorescence after each 1-h incubation period following F/T. (C) The population ratios of active liposomes (green dots in A) were plotted against the total incubation time. The black and red lines represent data from the first- or second-day experiments, respectively. RNA liposomes were subjected to F/T with liposomes that do not contain NTPs and Qβ-replicase (–nutrient) for five cycles as a negative control. (D) RNA concentrations in liposomes were plotted against the total incubation time. Note that the analysis was limited to liposomes with a lipid content of ATTO633 = 8,000–12,000 F.I.

