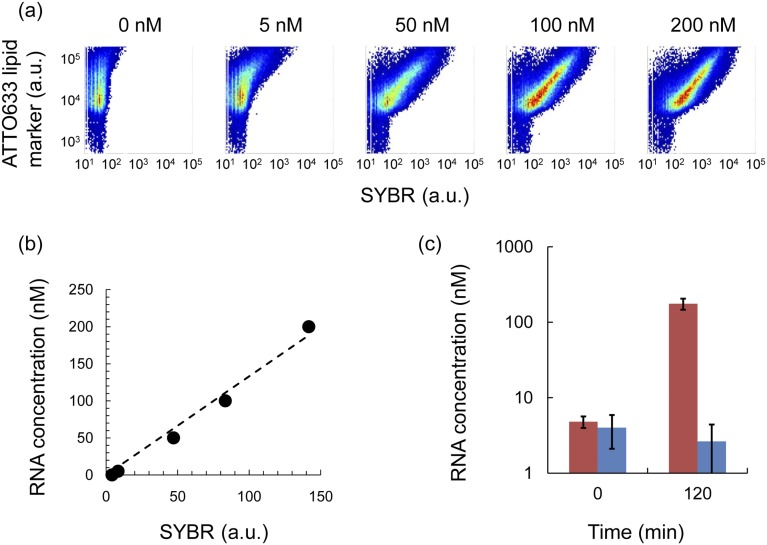
Fig. S2.
Probing RNA in liposomes with SYBR. (A) Liposomes were prepared by encapsulating Rep-RNA at concentrations of 0, 5, 50, 100, and 200 nM; probed with SYBR (see details in Materials and Methods); and measured by FCM. The horizontal axis shows SYBR fluorescence (RNA content), and the vertical axis shows the ATTO633 lipid marker fluorescence. (B) The correlation of the RNA concentration and SYBR fluorescence intensity (median) obtained from A was plotted. Analysis was limited to liposomes of significant size with ATTO633 F.I. = 8,000–12,000. Therefore, the RNA concentration in liposomes of major size (the main peak in Fig. 5B) was analyzed. The dashed line represents the linear fit and was used to estimate the RNA concentration in Fig. 5D. SYBR fluorescence intensity was converted to the Rep-RNA concentration according to the following equation: Rep-RNA (nM) = 1.33 × SYBR F.I. (C) The concentration of RNA from 100,000 liposomes (sorted by cell sorter by setting the gate as 20,000–50,000 F.I. of ATTO633 and 20,000–50,000 a.u. of forward-scattered light intensities) was quantified by qRT-PCR. Error bars indicate the SD of three independent experiments. The red bar indicates +nutrient, and blue bar indicates –nutrient conditions.

