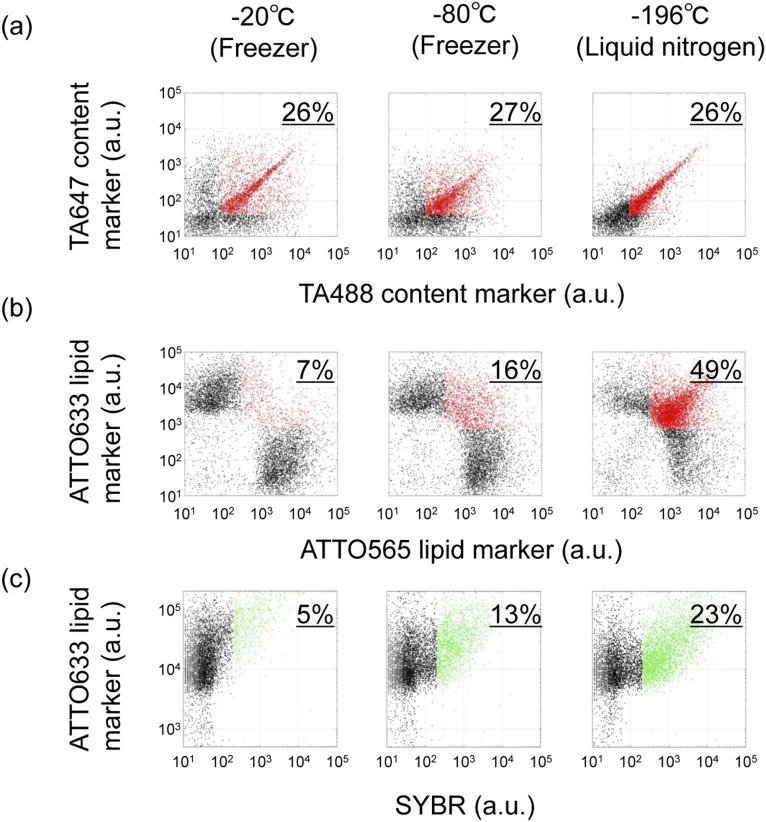
Fig. S5.
Content/lipid mixing and RNA replication after F/T in three different temperatures. Liposomes were subjected to F/T by freezing at –20 °C, –80 °C, or by liquid nitrogen. (A) Content mixings were measured using two liposome solutions as described in Fig. S1. The horizontal axis in 2D plots shows the fluorescence intensity of TA488, and the vertical axis shows the fluorescence of TA647. The population ratios of liposomes possessing both content markers (red dots) are written on the upper right of each plot. (B) Lipid mixings were measured using two liposome solutions as described in Fig. 1. The horizontal axis in 2D plots shows the fluorescence of ATTO565, and the vertical axis shows the fluorescence of ATTO633. The population ratios of liposomes possessing both lipid markers (red dots) are written on the upper right of each plot. (C) RNA replication was measured using two liposome solutions as described in Fig. 3. Following F/T at three temperatures, liposome solutions were incubated at 37 °C for RNA replication (60 min). The horizontal axis in 2D plots shows SYBR fluorescence (RNA content), and the vertical axis shows ATTO633 lipid marker fluorescence. The population ratios of liposomes in which RNA was significantly replicated (green dots) are written on the upper right of each plot.

