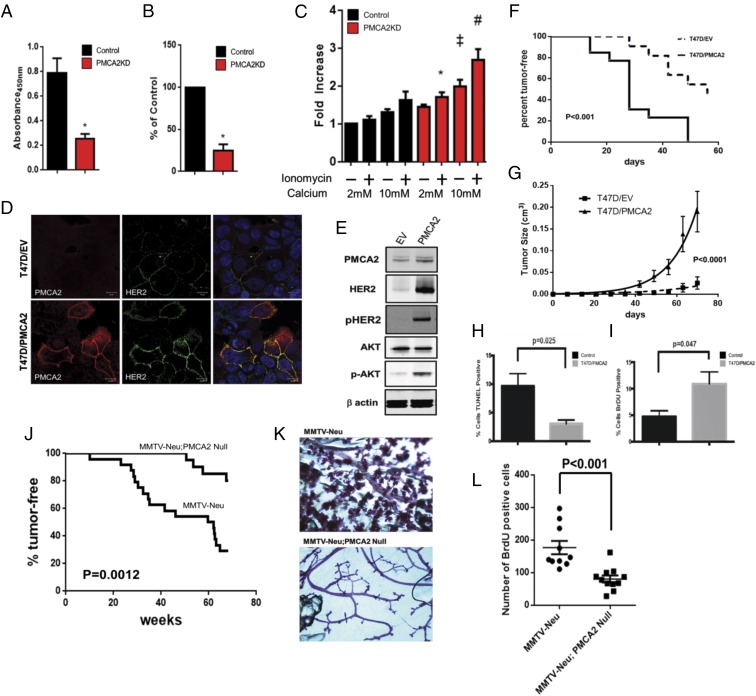
Fig. 2.
(A) Viable PMCA2KD and control cells as assessed by 2,3-bis-(2-methoxy-4-nitro-5-sulfophenyl)-2H-tetrazolium-5-carboxanilide (XTT) assay. Asterisks denote significant difference versus control (n = 6 for each group). (B) BrdU incorporation in PMCA2KD cells relative to control cells. Asterisk denotes a significant difference with control (n = 3). (C) Apoptosis, as assessed by TUNEL assay, in PMCA2KD cells relative to controls exposed to differing concentrations of extracellular calcium ± ionomycin. *Significant difference with 2 mM calcium + ionomycin in control cells. ‡Significant difference with 10 mM calcium in control cells. #Significant difference with 10 mM calcium + ionomycin in control cells (n = 3). (D) Immunofluorescence for PMCA2 (red) and HER2 (green) in T47D cells transfected with empty vector (T47D/EV; Top) or overexpressing PMCA2 (T47D/PMCA2; Bottom). (Right) Merged images with DAPI staining. (Scale bars, 10 μm.) (E) Typical immunoblot from control T47D cells (EV) or T47D cells overexpressing PMCA2 (PMCA2). (F) Kaplan-Meier plot showing tumor latency and incidence for control T47D/EV cells (n = 11) and T47D/PMCA2 cells (n = 13) grown as xenografts. (G) Rate of tumor enlargement for the same mice described in F. (H) Apoptosis in xenograft tumors from control T47D/EV cells or T47D/PMCA2 cells (n = 4). (I) Cell proliferation in same xenograft tumors as in H (n = 4). (J) Kaplan-Meier plot showing tumor latency and incidence in MMTV-Neu mice (n = 24) versus MMTV-Neu;PMCA2-null mice (n = 20). (K) Typical whole-mount histology of non-tumor-containing mammary glands from MMTV-Neu (Top) or MMTV-Neu;PMCA2-null (Bottom) mice. (L) BrdU incorporation in MMTV-Neu versus MMTV-Neu;PMCA2-null tumors (n = 16; four histological sections from each of four tumors for each genotype).

