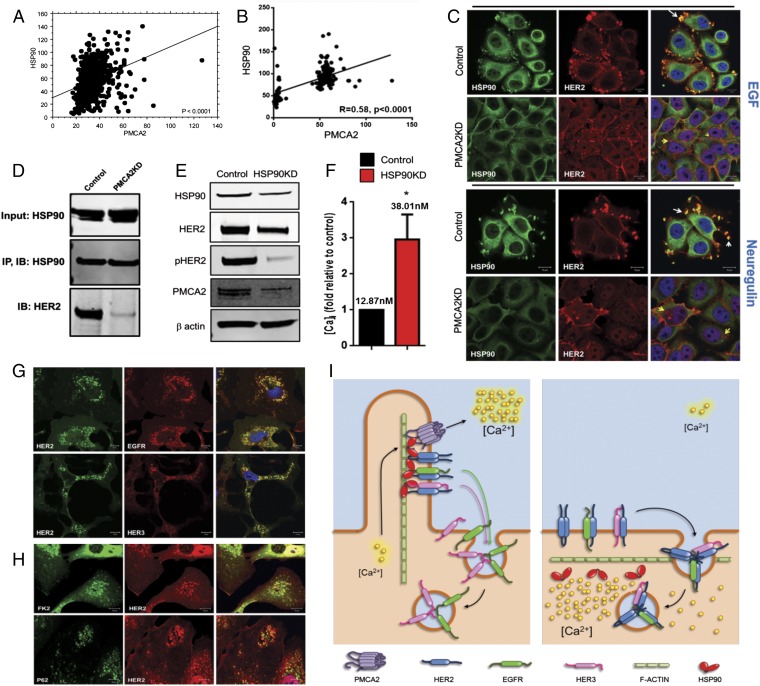
Fig. 5.
(A) Immunofluorescence automated quantitative analysis (AQUA) scores for PMCA2 versus HSP90 in breast cancer TMA. (B) PMCA2 versus HER2 mRNA levels in tumors from 204 patients with breast cancer. (C) Costaining of control and PMCA2KD cells for HSP-90 (green) and HER2 (red). (Right) Merged images. The top two rows show cells treated with EGF; the bottom two rows show cells treated with NRG1. White arrows point to colocalization of HER2 and HSP-90 in membrane protrusions in control cells. Yellow arrows point to internalized HER2, which no longer colocalizes with HSP-90 in PMCA2KD cells. (D) Co-IP of HSP-90 and HER2 in control and PMCA2KD cells. (E) Immunoblot for HSP90KD and control cells. (F) Intracellular calcium measurements in HSP90KD cells relative to controls. The numbers indicate the mean calcium measurements. *Statistical significance. (G) Costaining for HER2 and EGFR, and HER2 and HER3, in HSP90KD cells. (H) Costaining for HER2 and FK2, and HER2 and P62, in HSP90KD cells. (Scale bars, 10 μm.) (I) Model for interactions between PMCA2, HER2, and HSP-90 (Left) and consequences of loss of PMCA2 (Right).

