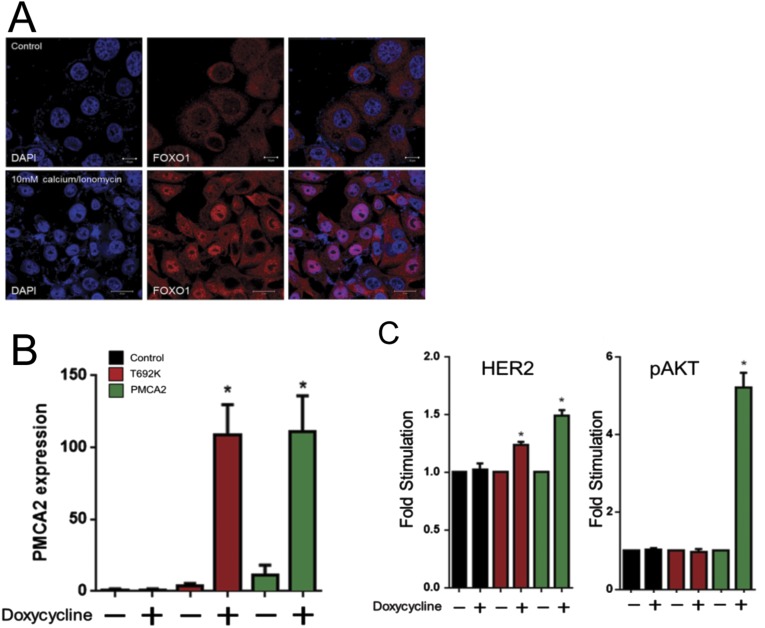
Fig. S4.
(A) Staining for FOXO1 in SKBR3 cells exposed to 2 mM calcium (Top) or 10 mM calcium and ionomycin (Bottom). (B) PMCA2 mRNA expression assayed by QPCR in control T47D cells and T47D cells induced to overexpress mutant PMCA2T692K or wtPMCA2 in response to treatment with doxycycline. Bars represent the mean ± SEM for three experiments. Asterisks denote significant differences compared with controls. (C) Quantification of HER2 and pAKT expression assayed by immunoblots in control T47D cells (black bars) and T47D cells induced to overexpress mutant PMCA2T692K (red bars) or wtPMCA2 (green bars) in response to treatment with doxycycline. Bars represent the mean ± SEM for three experiments Asterisks denote significant differences compared with controls.

