Fig. 4.
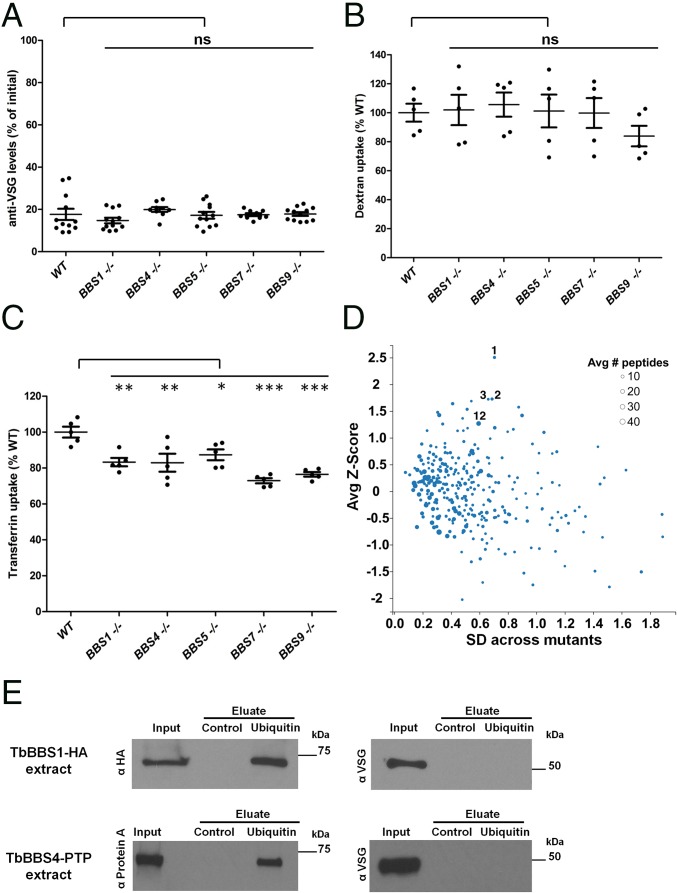
The TbBBSome regulates endocytic trafficking of select membrane proteins. (A) Anti-VSG levels at 5-min clearance as percentages of levels at 0 min. (B) Dextran uptake at 15 min as percentage of WT uptake. (C) Transferrin uptake at 15 min as percentage of WT uptake. In A–C, data are represented as means ± SEMs. ns, Not significant. *P < 0.05 by one-way ANOVA with Dunnett’s test; **P < 0.01 by one-way ANOVA with Dunnett’s test; and ***P < 0.001 by one-way ANOVA with Dunnett’s test. (D) Plot comparing cell surface protein abundance between WT and BBS mutants by stable isotope labeling by amino acids in cell culture (SILAC) proteomics. Only proteins detected in WT and all five BBS mutants are shown. The average BBS mutant to WT Z score of log2(fold change) is plotted against the SD across all five mutants. The size of each dot corresponds to the number of identified peptides per protein. Dots labeled 1, 2, 3, and 12 correspond to proteins in SI Appendix, Table S3 sorted by descending Z score (VSG-related, MBAP1, ESAG2, and ISG75, respectively). (E) Western blot for protein pulldowns. TbBBS1-HA and TbBBS4-PTP cell extracts were incubated with control beads and ubiquitin beads. Samples were blotted with anti-HA and anti-Protein A to detect tagged TbBBS proteins as well as anti-VSG as control for nonspecific pulldown. Input (1×) and eluate (320×) in anti-HA and anti-Protein A blots; Input (1×) and eluate (8,000×) in anti-VSG blots.

