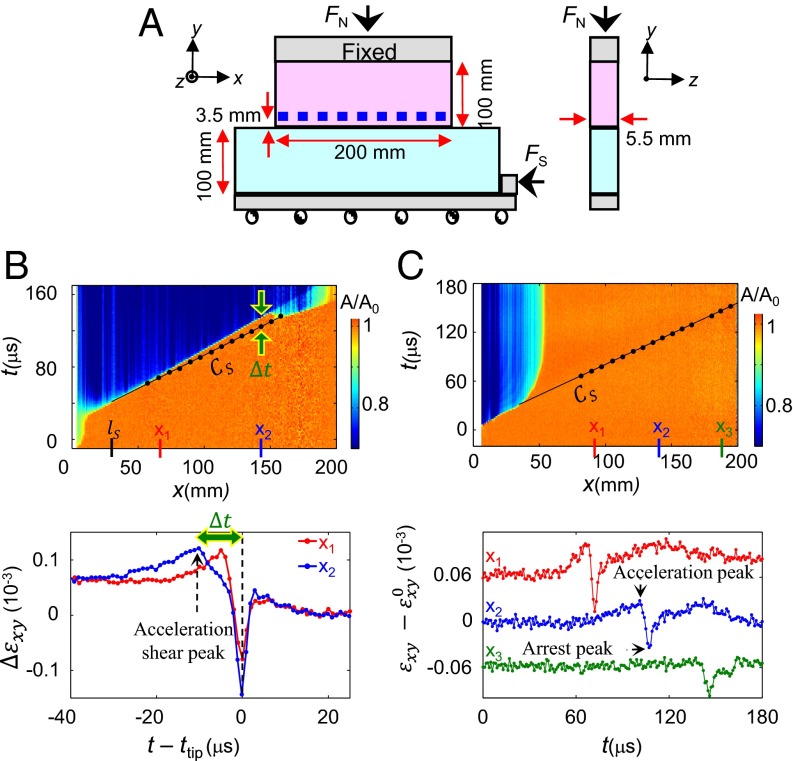
Fig. 1.
Prominent shear stress peaks due to accelerating or suddenly arrested frictional rupture fronts. (A) Nineteen rosette strain gauges (blue squares), mounted at mm measure the three 2D strain tensor components simultaneously every 1 μs. These are synchronized with real contact area, , measurements. (B, Top) evolution (normalized at nucleation time, ), along the quasi-1D interface due to a rupture front that nucleated at , rapidly accelerated to , and transitioned to supershear at mm. (Bottom) Shear strain variations, , relative to the rupture tip arrival time, , at the two locations, (red) and (blue) denoted above, show prominent amplitude shear strain peaks preceding the rupture tip arrival. For simplicity, we refer to these peaks as ‟shear stress peaks.” are residual values after the rupture front’s passage. Successive measurements (black points in upper panel) reveal that these peaks propagate at , and trigger supershear rupture. (C) Measurements of (Bottom) and the contact area (Top) reveal an inverted shear peak propagating at long after rupture arrest. Extrapolation (solid line) indicates that its origin coincides with rupture arrest. Arrest is due to decreasing values of with x (22, 24). (Bottom) measurements at three spatial points denoted above. The red (green) y axis is shifted by () relative to initial values, , for clarity. Black points in upper panels are measured peak locations.

