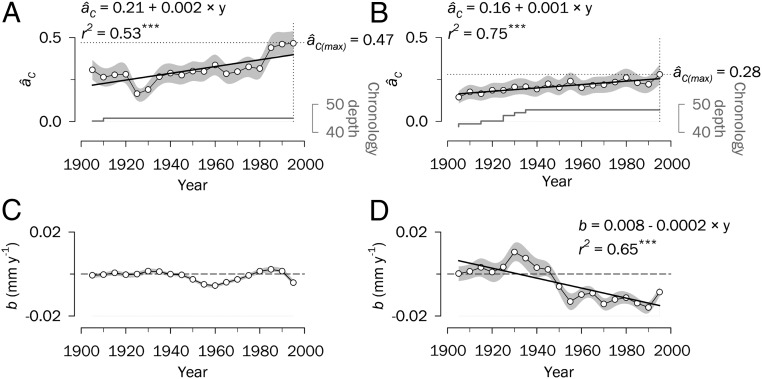
Fig. 1.
Synchrony patterns and changes in absolute growth for the period 1890–2009. (A and B) Spatial synchrony, âC, estimated for central Siberia (A) and Spain (B) using ring-width chronologies for successive 30-y periods lagged by 5 y. The dotted lines indicate âC maxima over the study period. Gray lines represent the number of chronologies with an EPS > 0.85 (i.e., chronology depth). (C and D) Temporal trends in the slope (b) of growth in central Siberia (C) and Spain (D) estimated based on raw ring-width data for the same time intervals used for synchrony. The dashed lines indicate no change in growth rate over the study period. Significant linear trends over time are depicted as black lines (***P < 0.001). Shaded areas denote SEs. Values on the x-axes correspond to the middle years of 30-y moving intervals.

