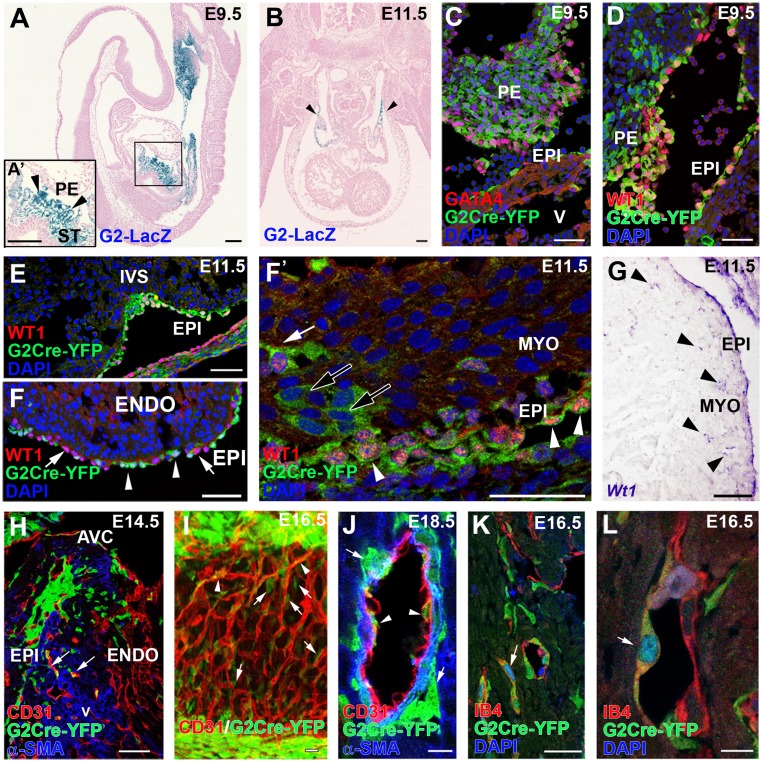
Fig. 1.
ST/PE G2-Gata4 cells throughout cardiac development. (A and B) G2-Gata4LacZ mice show reporter activity in the septum transversum (including the PE) at E9.5 (A) and inflow myocardium at E11.5 (B, arrowheads). (C and D) Immunohistochemistry of G2-Gata4CreYFP+ samples illustrates the expression of GATA4 (C) and WT1 (D) proteins in G2-Gata4CreYFP+ cells at E9.5 PE. (E–F′) G2-Gata4CreYFP mice show an increasing number of G2-Gata4CreYFP+ cells from the developing epicardium in subepicardial and intramyocardial areas between stages E10.5 and E14.5. The epicardium comprises WT1+/G2-Gata4+ (arrowheads) and WT1+/G2-Gata4− cells (F, arrows). A few EPDCs retain WT1 expression transiently (F and F′, white arrow), but other EPDCs do not (F′, black arrows). (G) Wt1 gene expression is conspicuous in the epicardium but is restricted to a few EPDCs (arrowheads). (H) Progressive expansion of EPDCs through the myocardial walls at E14.5–18.5 parallels G2-Gata4CreYFP+ incorporation in developing coronary blood vessels (arrows). (I and J) 3D reconstructions (I) and tissue section analysis (J) of the developing coronary vasculature allow perivascular cells (arrows in I and J) to be distinguished from G2-Gata4CreYFP+ CoE cells (arrowheads in I and J). (K and L) Identification of active Notch1 signaling by Notch1 intracellular domain (N1ICD) nuclear localization confirms the arterial nature of these vessels (arrows). A, atrium; AVC, atrio–ventricular canal; ENDO, endocardium; EPI, epicardium; IVS, interventricular septum; MYO, myocardium; PE, proepicardium; ST, septum transversum; V, ventricle. (Scale bars: 100 µm in A and B; 50 µm in C–H; 40 µm in I; 10 µm in J; 25 µm in K; 5 µm in L.)

