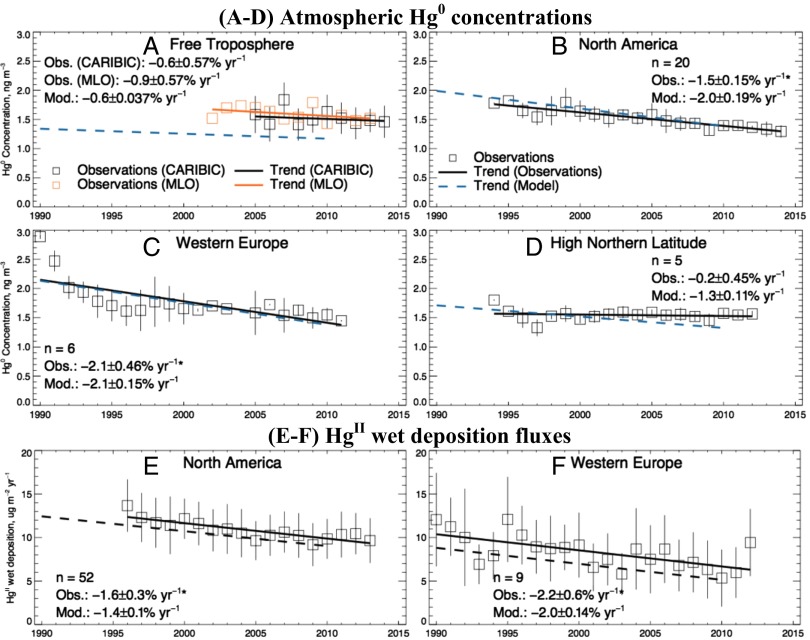
Fig. 3.
Regional trends for 1990 to 2013 in atmospheric Hg0 concentrations (A–D) and HgII wet deposition (E and F). Observations for individual years are shown as squares with linear regression as solid line. The dashed line is the trend from the GEOS-Chem simulation using our revised anthropogenic emissions inventory for 1990 and 2010 (Table 2). The data are averaged regionally across the sites in Table 1 for the free troposphere (A), North America (B and E), Western Europe (C and F), and high northern latitude regions (D) (vertical bars show the SDs). Regression coefficients (slope ± SE) and number of sites (n) are given (Insets). The SE of modeled trend is calculated based on the uncertainty range of the emission inventory (Table 2). North American atmospheric Hg0 concentrations are from the CAMNet (https://www.ec.gc.ca/natchem) and AMNet (nadp.sws.uiuc.edu/amn) networks and the Experimental Lakes Area, Canada. North American HgII wet deposition is from the MDN (nadp.sws.uiuc.edu/mdn). Observations in Western Europe are from the EMEP network (www.emep.int). High-latitude sites include Alert, Canada and Zeppelin, Norway, and three sites above 60° N from the EMEP network.

