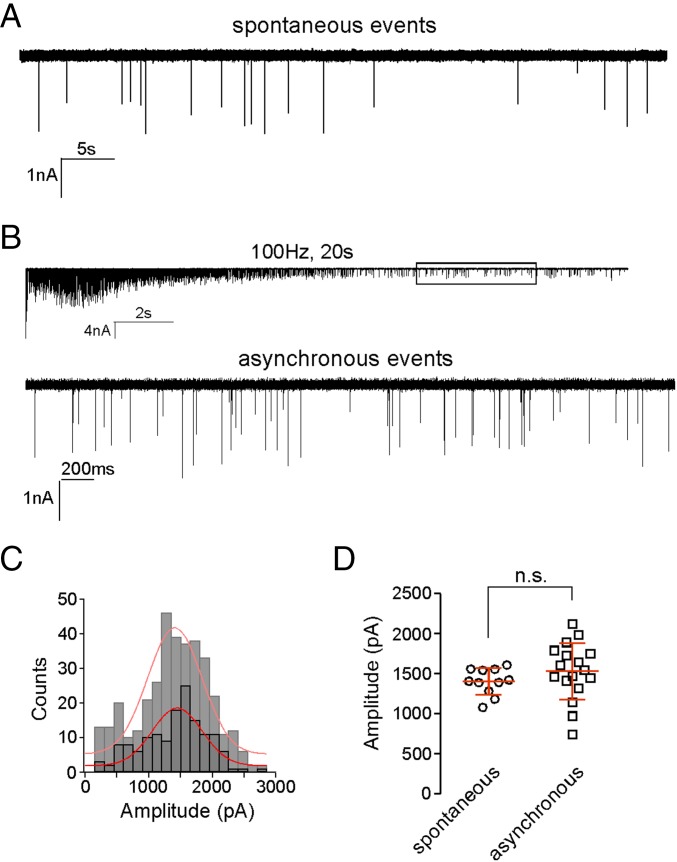
Fig. 2.
Measurement of unitary mEPC event amplitude. (A) Sample recording of spontaneous mEPC events. Spontaneous events averaged 17.8 ± 8.4 per min (n = 11). (B) A 100-Hz stimulation for 20 s depletes transmitter over time, leaving asynchronous unitary events. The boxed region is expanded to show the unitary asynchronous events in Lower. (C) Amplitude distributions comparing spontaneous (light gray) and asynchronous (dark gray) unitary events. To obtain sufficient numbers of events for generating the distribution of spontaneous unitary event amplitude, data were pooled from 11 cells. Sample distribution of asynchronous unitary events shown for the example recording in B. Each distribution was fit with a Gaussian function (red lines). (D) Scatterplot of the mean values for spontaneous and asynchronous unitary event amplitudes shown for individual recordings. The overall means obtained for spontaneous and asynchronous events are not significantly different (n.s.; P = 0.29).

