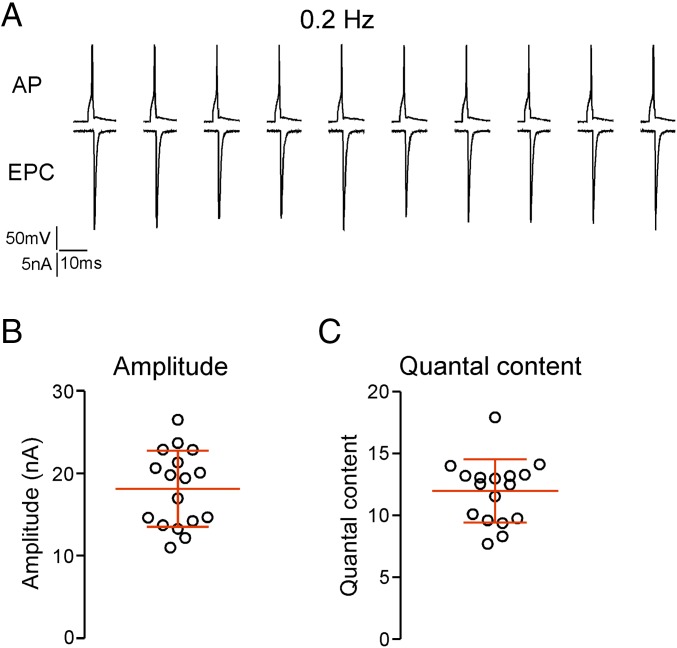
Fig. 3.
Estimating quantal content during 0.2-Hz stimulation. (A) Sample recordings showing the motor neuron action potential (AP) and associated muscle EPC. The traces are discontinuous because of the long interstimulus interval. (B) The mean EPC amplitude for individual recordings with associated overall mean and SD (n = 17). (C) The estimated quantal content for each of the recordings shown in B.

