Fig. 5.
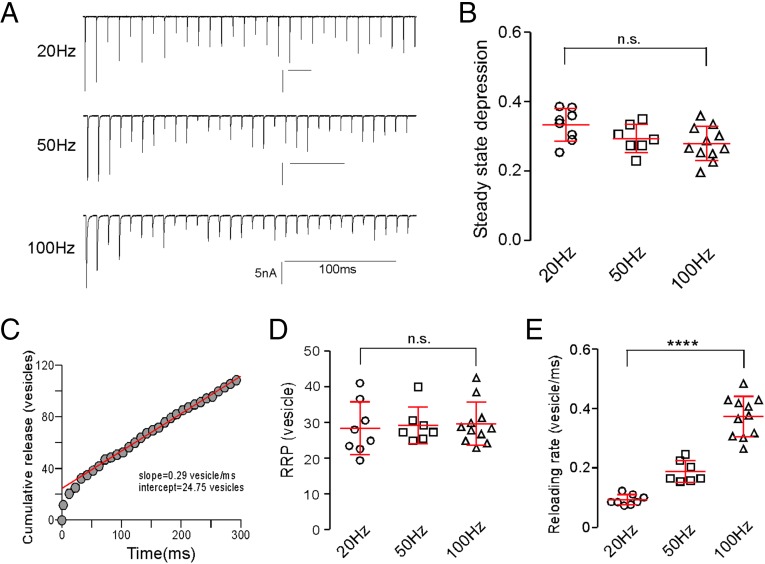
Frequency-dependent synaptic depression. (A) Sample EPC recordings in response to 30 stimuli delivered at three different frequencies. (B) Scatterplot of steady-state depression levels for individual recordings at each frequency. The steady-state depression was based on the ratio of average steady-state EPC amplitude to the first EPC. The overall mean ± SD values are shown. n.s., P = 0.056 (one-way ANOVA). (C) A representative cumulative release time course for the 100-Hz recording shown in A. Each circle represents a 10-ms epoch. The release was converted from amplitude to vesicle number on the basis of quantal size. The red line represents the best linear fit for data points between the 60- and 300-ms regions backextrapolated to time zero. The indicated y intercept and slope provided estimates for the RRP size and the reloading rate for the cell, respectively. (D) Estimates of the size of the RRP pool for individual recordings and overall mean ± SD at each frequency. n.s., P = 0.9 (one-way ANOVA). (E) Estimates of the reloading rates for individual recordings at different stimulus frequencies. ****P < 0.0001 (one-way ANOVA).

