Fig. 7.
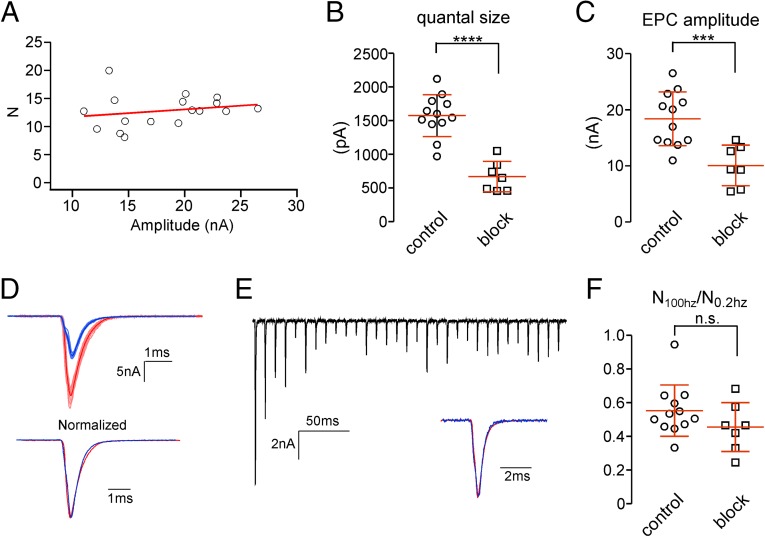
Estimating N under conditions of partial postsynaptic conductance block. (A) Scatterplot of N estimates vs. mean EPC amplitude at 0.2 Hz for control condition. Each symbol represents an individual recording with a trend line shown in red. (B) Scatterplot of quantal size determined from Gaussian fit to asynchronous event amplitude distributions for both control and partial blocked conditions. ****P < 0.0001. (C) Scatterplot of EPC amplitudes at 0.2 Hz for both control and partial blocked conditions. ***P < 0.001. (D) Sample recordings of control (red) and blocked (blue) EPCs obtained in response to a 0.2-Hz stimulation. (Upper) Ten individual EPCs (light red and light blue) were used to generate the average EPCs (dark red and dark blue). (Lower) The averages were normalized for comparison of waveform. (E) Sample recording of partially blocked EPCs at 100-Hz stimulation. Inset compares the average postdepression EPC (blue; averaged from the 10th, 15th, 20th, 25th, and 30th EPCs in the train) normalized to the first EPC in the train (red). (F) The extent of drop in N is represented as the ratio of N at 100 to 0.2 Hz; 12 recordings are shown for the control, and 7 recordings are shown (2 α-btx and 5 d-tubocurare) for the partial blocked condition. n.s., P = 0.7.

