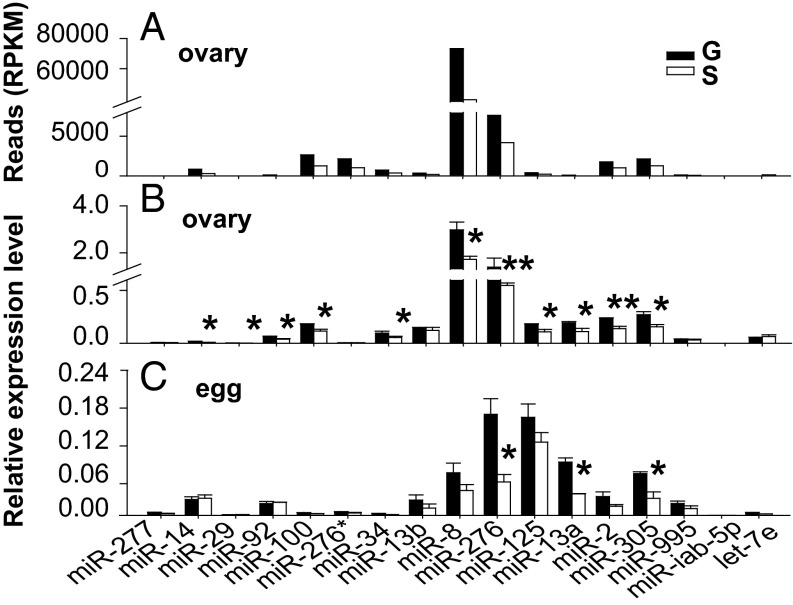
Fig. 2.
miRNA expressions in ovaries and eggs from gregarious (G) and solitarious (S) locusts. (A and B) Comparison of miRNAs in ovaries between gregarious and solitarious locusts by high-throughput sequencing (A) and qPCR (B). RPKM, reads per kilobase per million mapped reads. (C) Expression levels of differentially expressed miRNAs in ovaries were determined in eggs from gregarious and solitarious locusts by qPCR. The data are shown as mean ± SEM, *P < 0.05, **P < 0.01, n = 6.

