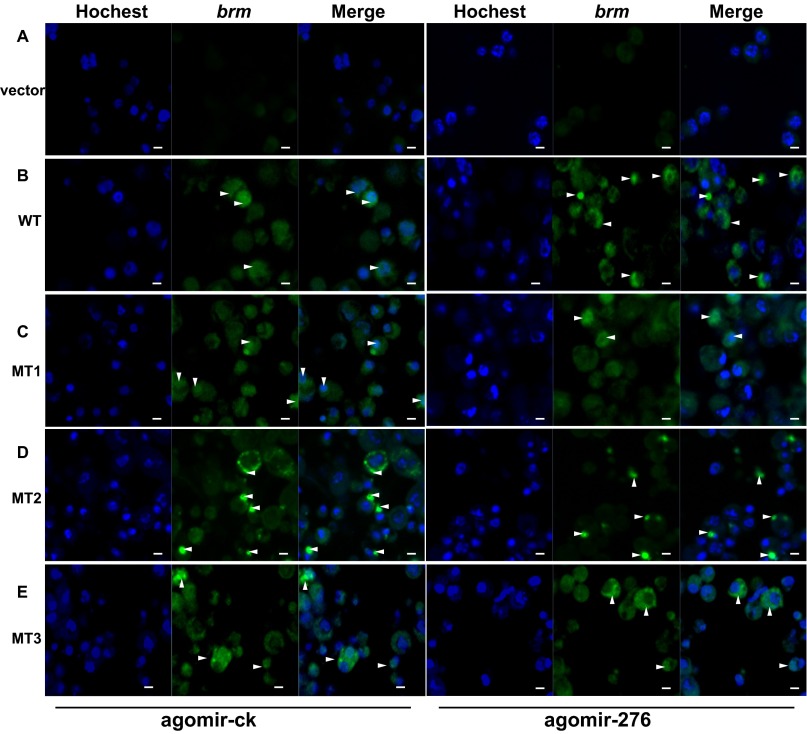
Fig. S6.
The FISH experiment for brm location in the S2 cell. (A) Control cells mock transfected with empty vectors. (B) In cells transfected with WT, most brm transported to the cytoplasm in the presence of agomir-276, compared with the results of agomir-ck. (C) For cells transfected with MT1, a substantial portion of brm accumulated in the nucleus either in the presence of agomir-276 or not. (D and E) For cells transfected with MT2 (D) or MT3 (E), most of the brm RNAs transported to the cytoplasm either in the presence of agomir-276 or not. The arrow indicates the location of brm. (Scale bars: 5 μm.)

