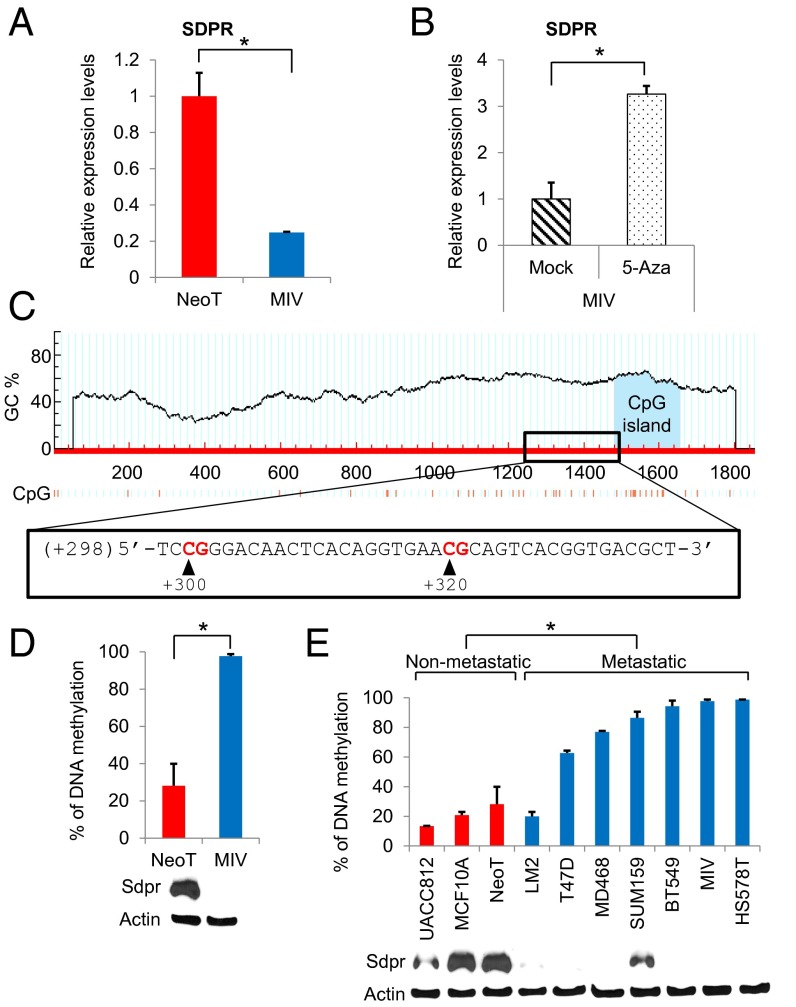
Fig. 6.
Epigenetic regulation of SDPR expression. (A) The relative expression levels of SDPR in NeoT and MIV cells was measured by quantitative RT-PCR, P = 0.0127, n = 3. (B) Effect of 5-Aza treatment on SDPR mRNA levels in MIV cells, P = 0.02, n = 3. (C) Analysis of −1000 to +1000 region of SDPR transcription start site for CpG sites using the MethPrimer online tool. (D) Methylation-specific quantitative PCR was used to assess the percentage of DNA methylation at the SDPR promoter region in NeoT and MIV cell lines, P = 0.0116, n = 3. SDPR protein levels are depicted below the graph. (E) The percentage of DNA methylation at the SDPR promoter region across nonmetastatic and metastatic breast cancer cell lines, P = 0.0007. SDPR protein levels are depicted below the graph. *P < 0.05.

