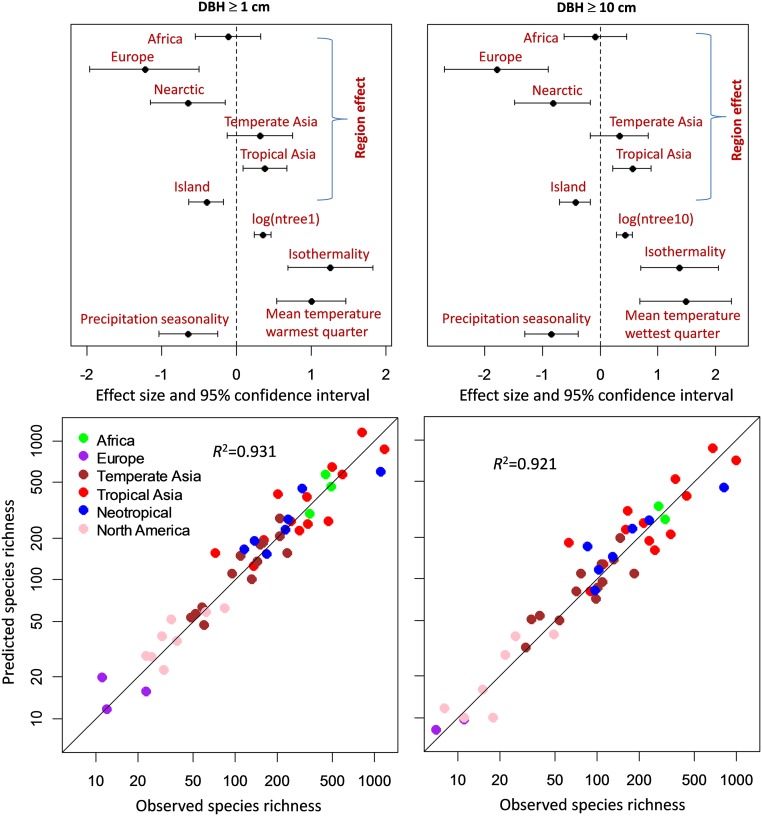
Fig. 3.
Magnitude of the effects of region, number of plot stems, and significant local climate and plot variables predicting species richness. (Upper) Coefficients of the negative binomial generalized linear models (Table 2) and their 95% confidence intervals for DBH ≥ 1 cm (Left) and 10 cm (Right), respectively. Neotropical sites define the baseline for the region effects. (Lower) Relationships between the observed species richness and the richness predicted from the corresponding generalized linear models for the two DBH classes. If the models predicted species richness perfectly, the points would fall on the diagonal lines.

