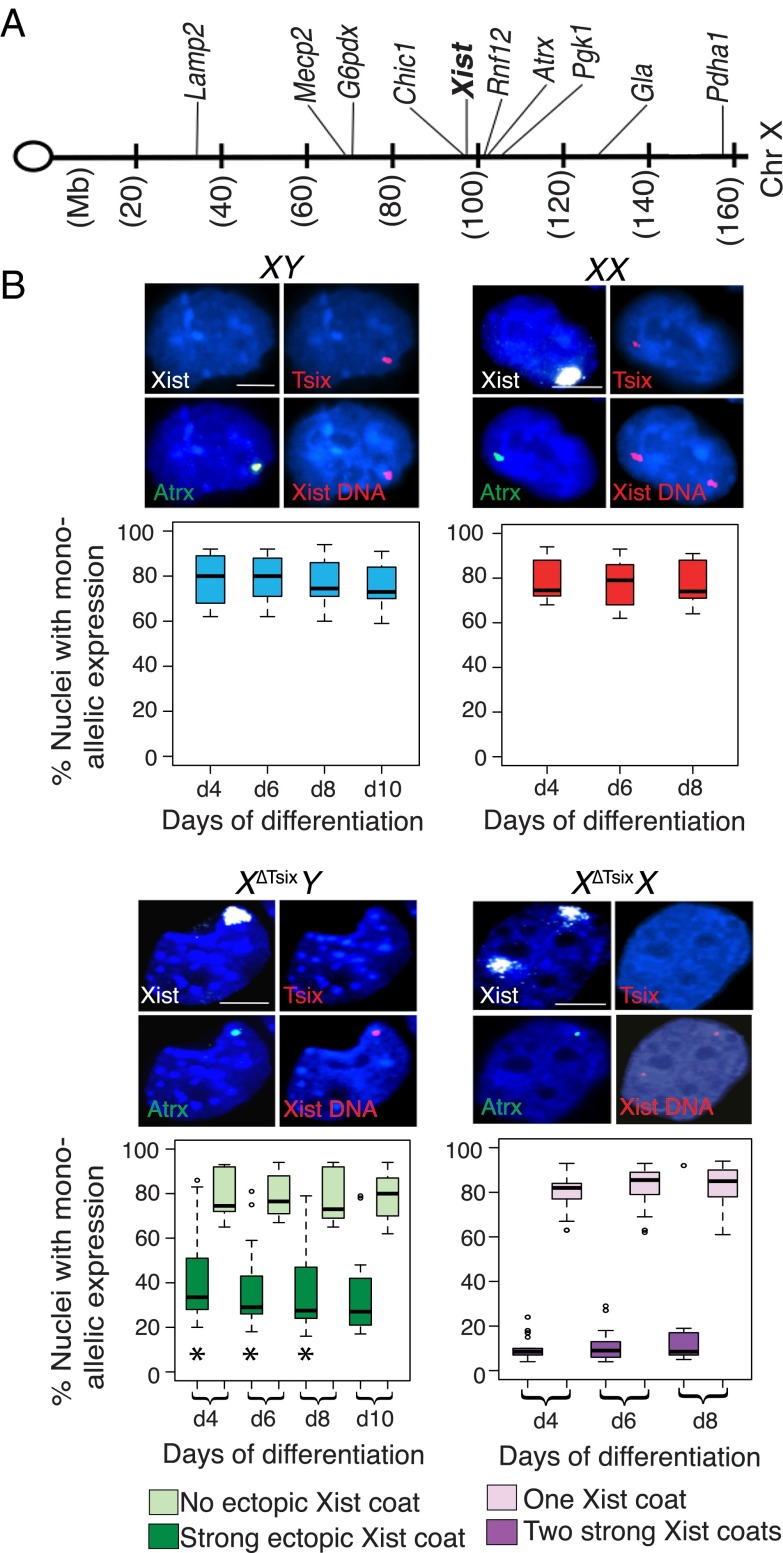
Fig. 2.
Differential silencing of X-linked genes upon ectopic Xist RNA coating in differentiating X∆TsixY and X∆TsixX ESCs. (A) X-chromosomal localization of the genes profiled by RNA FISH. (B) A representative nucleus stained to detect Xist RNA (white), Tsix RNA (red), and nascent transcripts of one of the nine genes surveyed (Atrx, green) is shown above boxplots of each genotype. Following RNA FISH, the Xist locus was detected by DNA FISH. Nuclei are stained blue with DAPI. Boxplots show the median percent gene expression (line), second to third quartiles (box), and 1.5 times the interquartile range (whiskers). d, day. In XY and XX cells, nuclei exhibiting monoallelic expression are plotted. In X∆TsixY cells, percent nuclei with monoallelic expression of the genes both without coincident Xist RNA coat and with strong ectopic Xist RNA coats are plotted. In X∆TsixX cells, percent nuclei with monoallelic expression of the genes coincident with a single Xist RNA coat and with two strong ectopic Xist RNA coats are plotted. Two cell lines of each genotype were analyzed. n = 100 nuclei per cell line per day of differentiation for each class of Xist RNA-coated cells. (Scale bar, 2 μm.) *P < 0.003, significant difference in gene expression between X∆TsixY and X∆TsixX nuclei; Welch’s two-sample T test. X-linked gene expression does not differ significantly between X∆TsixY and X∆TsixX nuclei lacking ectopic Xist coats (P > 0.2). Related data are included in SI Appendix, Figs. S2 and S3.

