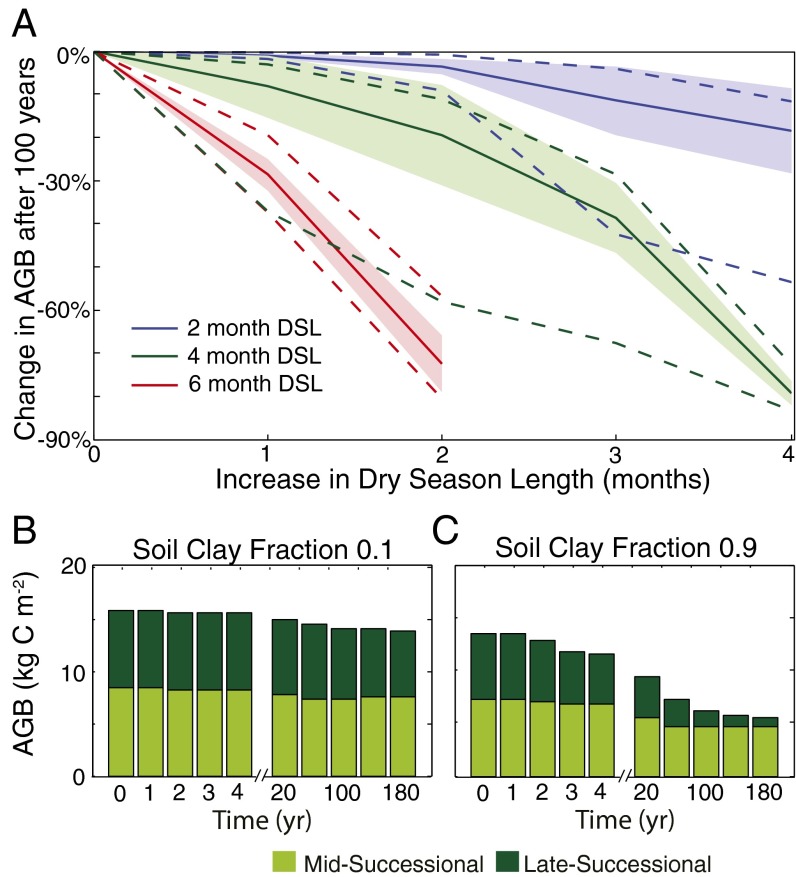
Fig. 3.
Predicted response of forest AGB and composition to an increase in DSL. (A) Change in AGB after 100 y as a result of increasing DSL for forests with historic DSLs of 2, 4, and 6 months for the range of soil textures simulated in the ensemble model simulations (n = 30). The magnitude of the change in AGB is influenced by soil clay fraction: The mean (solid line), 1σ deviation (shaded region), and minimum and maximum values (dashed lines) are shown. (B and C) Bar plots illustrating the impact of a 2-month increase in dry season (from 4 to 6 months) on a forest situated on a low clay content soil and a forest situated on a high clay content soil. The color of the bars indicates the contribution of mid- and late-successional trees, illustrating the shift in composition caused by the increase in DSL.

