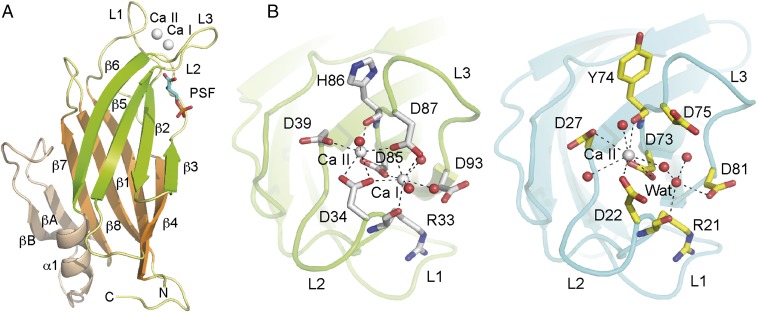
Fig. 1.
The crystal structures of CAR4 and CAR1. (A) A ribbon representation of CAR4 in complex with Ca2+ and PSF. (B) The ribbon representation of the Ca2+-dependent lipid binding sites of CAR4 (Left) and CAR1 (Right). The key structural features of the CAR fold are labeled and highlighted in different colors. The Ca2+ atoms are shown as gray spheres. Other nonprotein atoms and key residues at the Ca2+ binding sites are displayed in a ball-and-stick representation.

