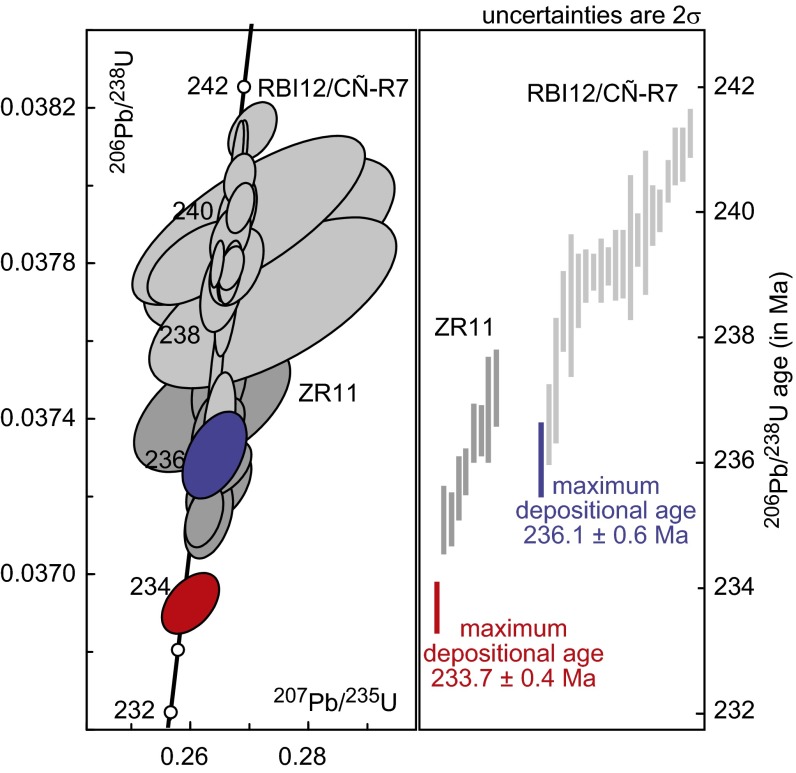
Fig. 2.
ID-TIMS U–Pb single-zircon analyses for samples RBI12/CN-R7 (light gray/blue) and ZR11 (dark gray/red). Panels show concordia plot (Left) and age-ranked representation (Right), including age interpretation considering the youngest age of each sample as maximum depositional age. Data and further discussion of these analyses can be found in SI Appendix.

