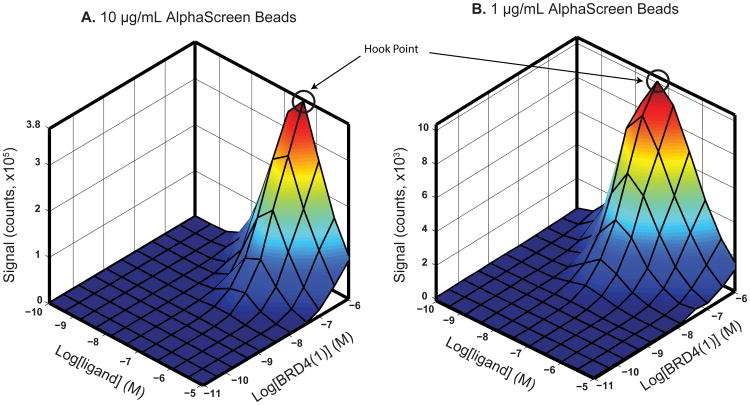
Figure 2. Ligand and protein concentration optimization.
Graphs show the change in Alpha signal (counts) with varying protein (BRD4(1)) and ligand (Bio-JQ1) concentrations for (A) 10 μg/mL and (B) 1 μg/mL of AlphaScreen beads. A 3D surface was mapped onto the average of triplicate data points. While the general curves are the same, 1 μg/mL of AlphaScreen beads results in a much lower signal. The hook point in (A) is at approximately 10-6.5 M (316 nM) and in (B) at 10-7.5 M (31.6 nM) ligand.

