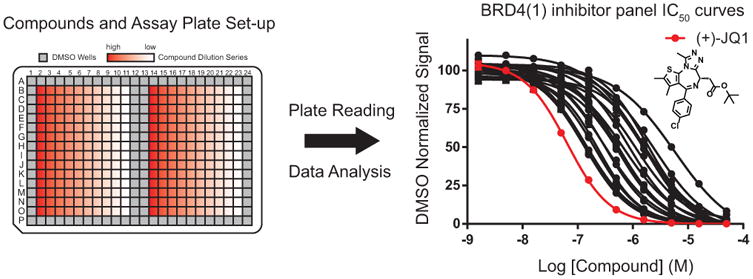
Figure 3. Competitive inhibition assay plate and dose-response curves for inhibitors of BRD4(1).

The left panel depicts the setup of a 384-well compound plate with serial dilutions of potential inhibitors. Samples are excluded from perimeter wells to prevent signal inconsistency from evaporation and light exposure at the edge of the plate. DMSO-containing wells in the center of the plate will be used to normalize signal. After plate reading and analysis, dose response curves and IC50 values for inhibitors of BRD4(1) are generated, as depicted in the right panel. (+)-JQ1 is included as a positive control (shown in red).
