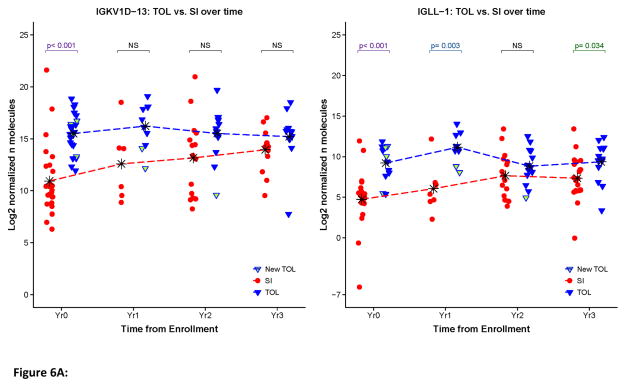
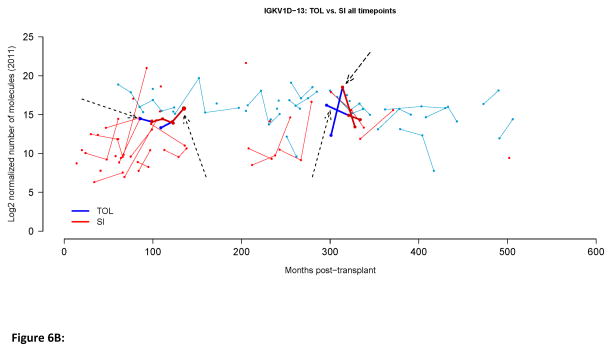
Figure 6.
Longitudinal IGKV1D-13 and IGLL-1 expression. A. Scatter plots for normalized IGKV1D-13 and IGLL-1 expression in all available samples. The time points indicate the point at which the sample was obtained relative to the start of the study, i.e., year 0 is the first blood sample we obtained, year 1 is one year later, etc. Mean values for each group at each time point are represented by * and connected by dashed lines. P-values represent comparisons between the groups at each time point. B. Longitudinal IGKV1D-13 expression as a function of months post-transplant. Tolerant patients (TOL) are shown in blue, patients on standard immunosuppressive therapy (SI) are shown in red. Points joined by a line depict sequential samples from the same participant. Arrows indicate four patients that were operationally tolerant when first studied, but later went back on immunosuppressive therapy.


