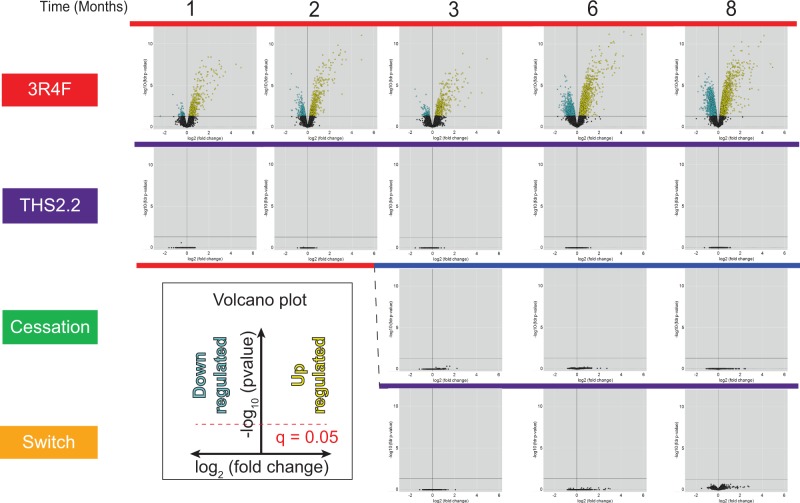
FIG. 13.
Volcano plots representing the systems response profiles in the lung. Gene expression change, calculated as the log2 fold-change, is plotted on the x-axis and the significance, proportional to the negative log10 (false discovery rate-adjusted P-value), is plotted on the y-axis. Yellow and blue dots highlight genes that are significantly up- or downregulated, respectively, compared with the sham group at each respective time-point. Full color version available online.

