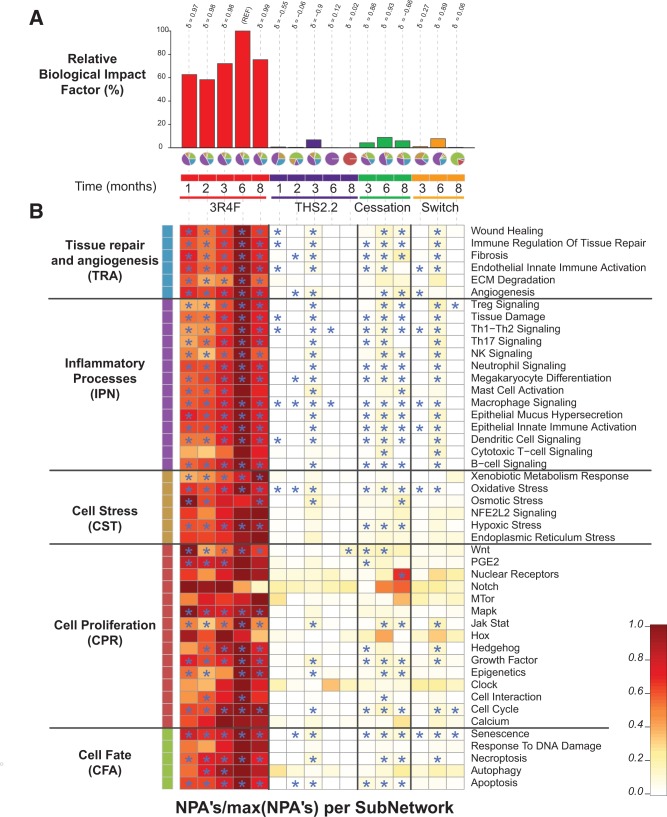
FIG. 14.
Network-based biological impact factor (BIF) and network perturbation amplitude (NPA) analysis from the lung. A, Relative BIF (RBIF) for treatment versus sham. The percentages show the relative biological impact which is derived from the cumulated network perturbations caused by the treatment relative to the reference (defined as the treatment comparison showing the highest perturbation, ie, at the 6-month time-point). For each treatment comparison, the δ value ( − 1 to 1) indicates how similar the underlying network perturbations are with respect to the reference (ie, 3R4F at 6 months). A δ value of 1 indicates that all networks are perturbed by the same mechanisms. The small pie charts underneath the RBIF bars demonstrates the relative contributions by the NPAs of the 5 underlying network models (indicated by the segment colors) which are shown in greater detail in Figure 14B. B, Heatmap of NPA Scores summarizing subnetwork NPAs relative to the maximum NPA in each subnetwork. Stars indicate significant perturbations: a network is considered as perturbed if, in addition to the significance of the NPA score with respect to the experimental variation, the 2 companion statistics (O and K) derived to inform on the specificity of the NPA score with respect to the biology described in the network, are significant. *O and K statistic P-values below 0.05 and significant with respect to the experimental variation.

