FIG. 15.
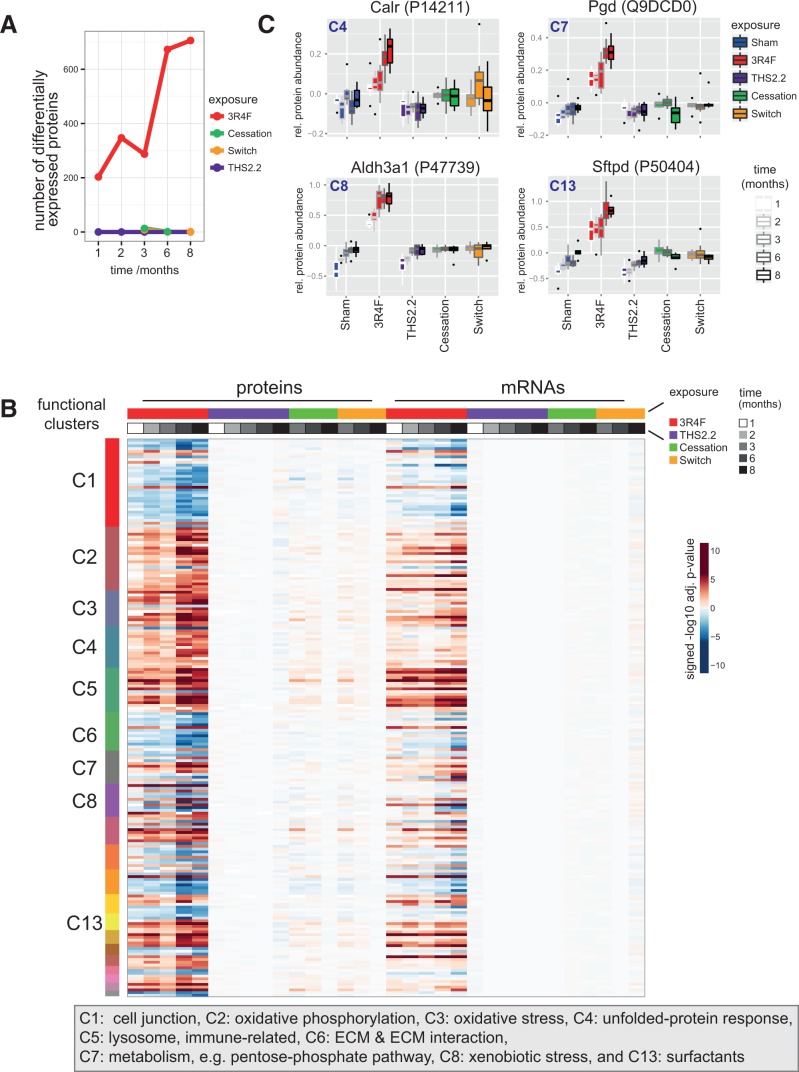
Lung proteomics. A, Number of differentially abundant proteins (DAPs) across exposure conditions and time-points. DAPs with a Benjamini-Hochberg adjusted P-value < .05 were considered. B, Comparison of protein and mRNA response profiles for the identified association clusters across all conditions. Differential expression heatmap (signed log10 adj. P-values) for proteins in the clusters (rows) across all conditions (columns). The cluster membership is indicated by the color bar on the left, and color bars on top indicate the sample groups and data modalities (protein or mRNA measurement). See Supplementary Figure 14 for protein names. C, Sample-level response profiles for selected key proteins representing 4 of the affected biological processes: calreticulin (Calr) for the unfolded-protein response, phosphogluconate dehydrogenase (Pgd) for the pentose-phosphate pathway, aldehyde dehydrogenase 3A1 (Aldh3a1) for xenobiotic metabolism, and surfactant protein D (Sftpd) for the surfactant cluster. Boxplots show the median and interquartile range for each exposure condition and time-point (increasing from left to right).

