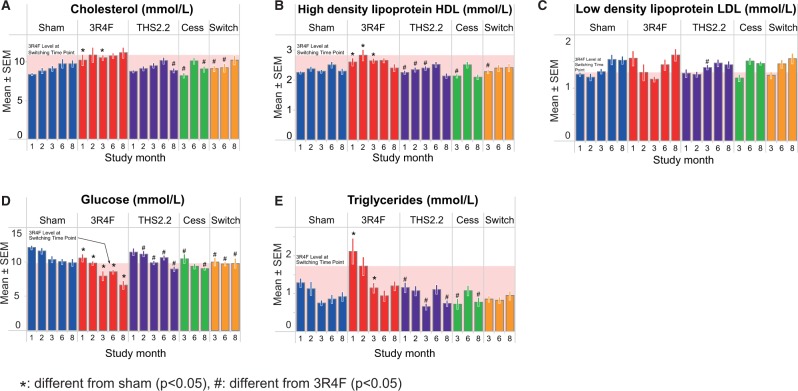
FIG. 2.
Clinical chemistry. Measurements by autoanalyzer. A, Total cholesterol (enzymatic/biochemical detection). B, High-density lipoprotein (enzymatic/biochemical detection). C, Low density lipoprotein (calculated according to the Friedewald formula). D, Glucose (enzymatic/biochemical detection). E, Triglycerides (enzymatic/biochemical detection). Data are means ± SEM, n = 8–10. Statistics describe comparison with sham-exposed animals. *P < .05 or with 3R4F-exposed animals #P<.05. The shaded area indicates the 3R4F value at the switching/cessation time-point (month 2).

