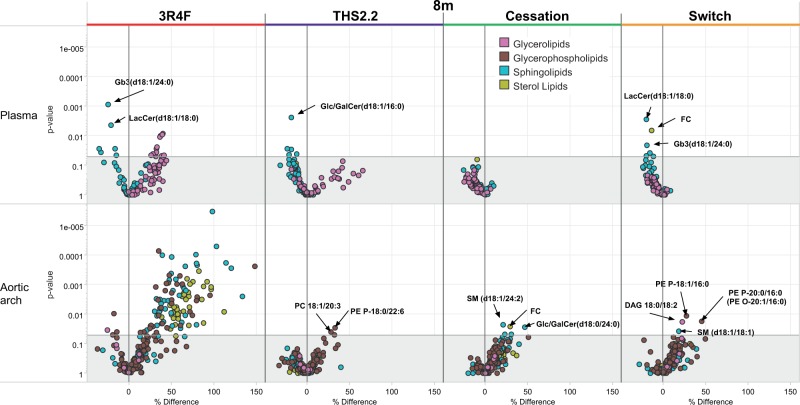
FIG. 5.
Lipidomics profiles of aortic arch and plasma in Apoe−/− mice exposed for 8 months to cigarette smoke (3R4F), THS2.2, or to a cessation or switch protocol (2 months 3R4F followed by 6 months fresh air or THS2.2, respectively) compared with sham exposure for 8 months. Each dot in the volcano plot represents a measured lipid. Lipid classes, as defined by the Lipid Maps consortium, are color coded and indicated in the legend.

