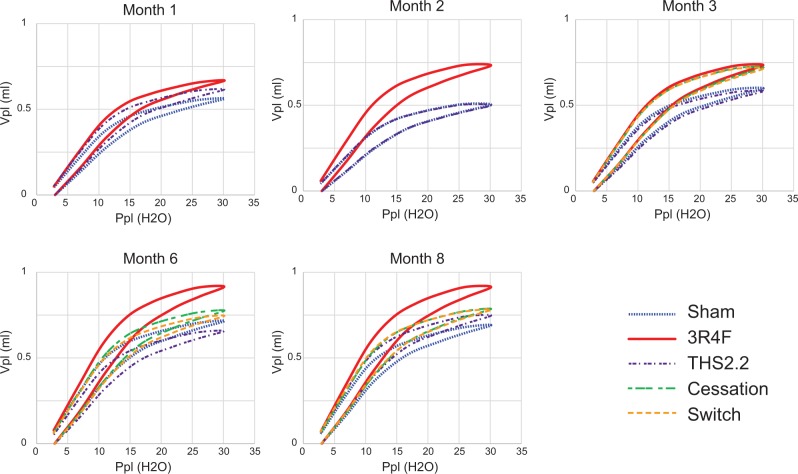
FIG. 6.
Pressure/volume loops. Lung function was measured in selected animals 18–24 h after exposure using the FlexiVent system (Scireq). “Airway” constriction and lung “stiffness” were assessed by measuring pressure, flow, and volume relationships in the respiratory system, and by using forced oscillations to discriminate between airway and lung tissue variables according to complex mathematical models (for details, see Phillips et al., 2015). The relationship between pressure (Ppl, pressure plethysmography) and the resultant volume (Vpl, volume plethysmography) over an inflation/deflation cycle is shown. Data are means without SDs, n = 9–10.

